
EII-EII-Oh!
With a healthy creek here and a dirty creek there, how do we measure creek health? The Environmental Integrity Index (EII) is a program designed to continuously monitor and assess the water quality of Austin’s creeks and streams.
Austin’s creeks once ran clear in the wilderness, but now they run through the wilds of the city, picking up pollution and absorbing runoff from impervious cover and heavy rain storms. In order to understand how these urban challenges affect our creeks and develop policies that can protect them, the City of Austin uses a program called the Environmental Integrity Index (EII).
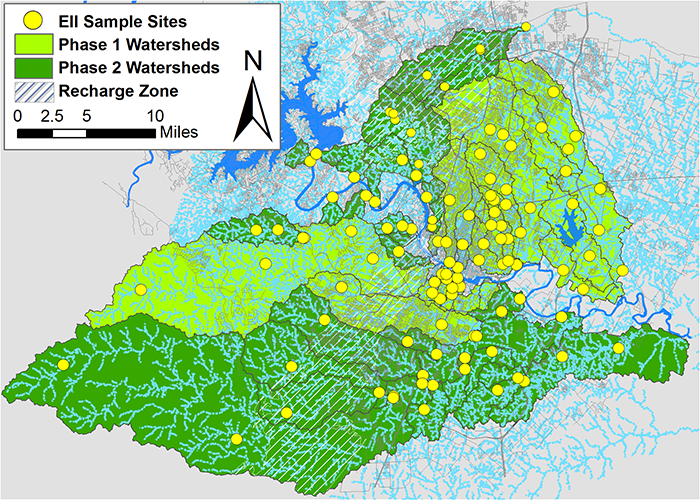
Over 120 sites from 49 watersheds are sampled on a two-year rotating basis
With a sample, sample here...
Four times a year, teams of Watershed Protection Department scientists are deployed to Austin’s creeks to collect water quality information. The field data, pH, dissolved oxygen (DO), temperature and conductivity, are collected to describe the characteristics of the stream. If the results of these five characteristics are outside of the expected range, it could indicate a source of pollution.
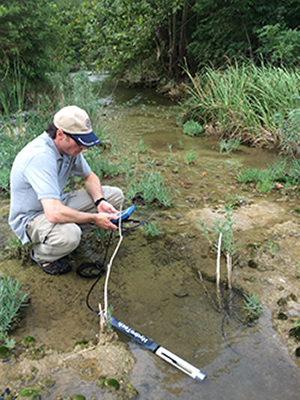
pH, DO, temperature and conductivity are measured with electronic instruments at each site visit.
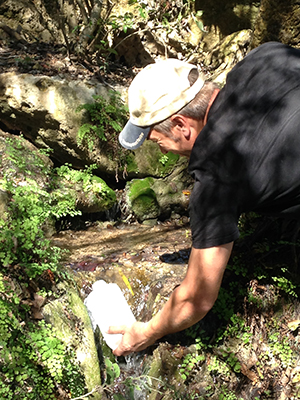
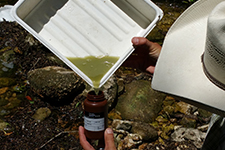
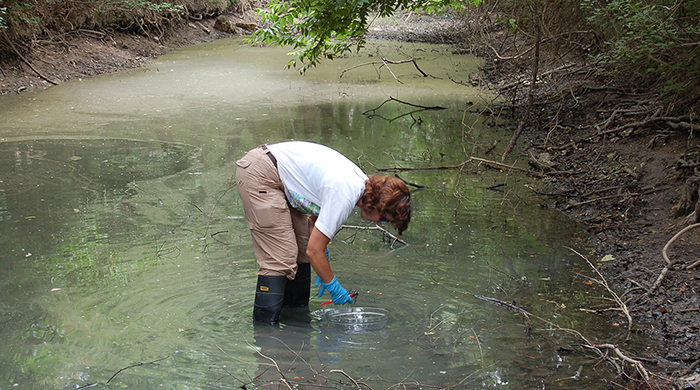
Samples are taken to a lab after they are collected in sterile bottles that have special preservatives.
Water samples are analyzed for E.coli bacteria, turbidity, total suspended solids and nutrients. E.coli bacteria are present in creeks at low levels from wildlife, but high levels can indicate contamination from sewage, pets, livestock or humans. When levels of E coli are abnormally high, our team does follow-up data collection to detect the potential source of the problem. High levels of nutrients can come from fertilizers and wastewater contamination and can cause water quality problems including algae blooms and fish kills.
And in that creek there are some bugs
Although sampling for water chemistry is a good start, it only gives information about one point in time. The diversity and complexity of the biological community, the physical conditions of the creek habitat, and the chemical substances found in the sediment provide longer-term, deeper indicators of stream health. To assess the biological community, the teams collect diatoms (a type of algae) and benthic macroinvertebrates (water bugs) at study sites annually, usually in early summer.
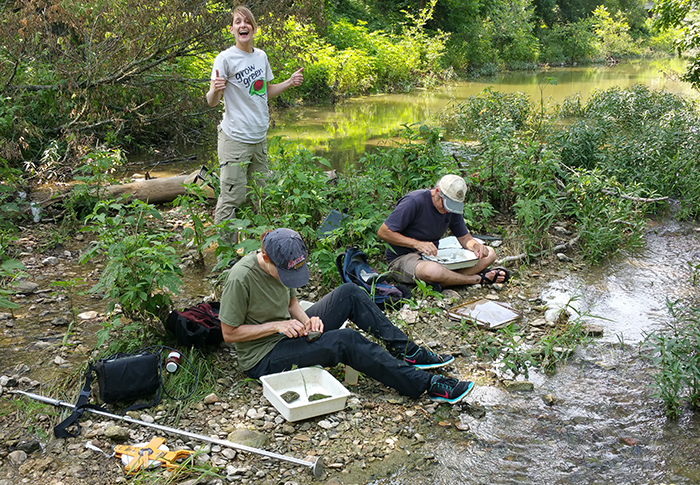
Each summer the team collects biological and physical data
Our scientists collect about 200 benthic macroinvertebrates from each creek where the water is moving fast and has lots of oxygen. The species in each of these samples are identified and counted in our lab by taxonomic experts. A healthy macroinvertebrate community has a good balance of plant eaters, predators, and those that eat decomposing organic matter. A healthy community will also include sensitive species that are intolerant to pollution. Their presence indicates good water quality.
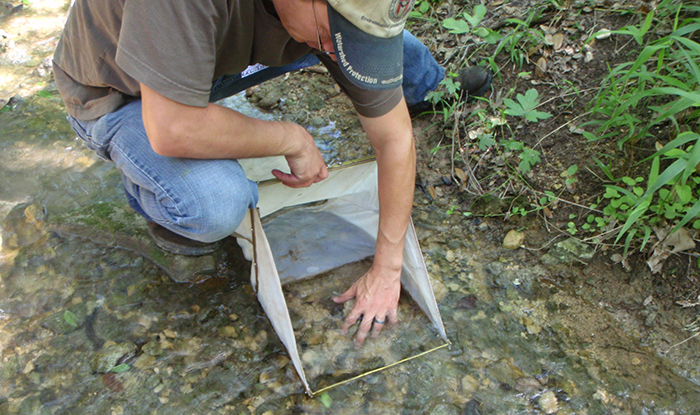
Scientists collect aquatic invertebrates, pick them from white pans and bring them back to the lab for identification.
The team also samples the microscopic diatom (a type of algae) community by scraping the surface of rocks in the stream with a metal brush within a small circle. Diversity in these samples can indicate water quality. Our taxonomist counts and identifies 500 diatoms in each sample to get a good representation of the community.
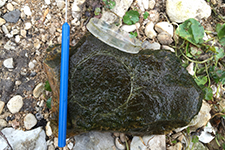
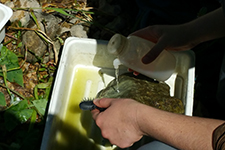
Diatoms are scraped off of 3 rocks per site and washed into a sample bottle.
Physical Conditions
During the summer site visit, the scientists also collect physical information from the stream. This helps determine geophysical aspects of the creek, such as how much water is flowing at the time, how stable the banks are, and the quality of the habitat.
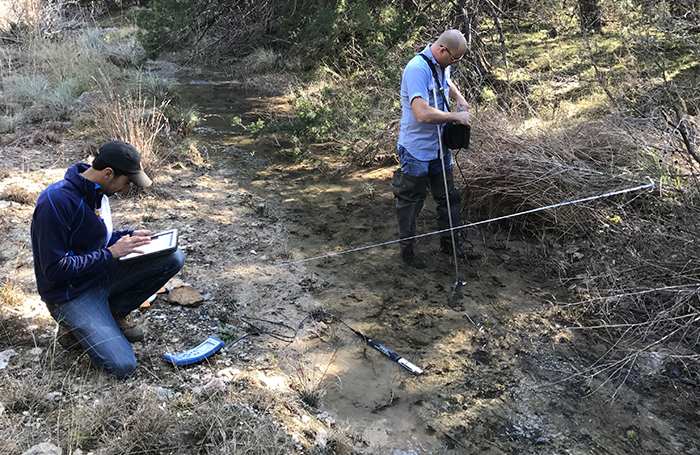
Stream cross section and velocity are used to calculate the total discharge of water
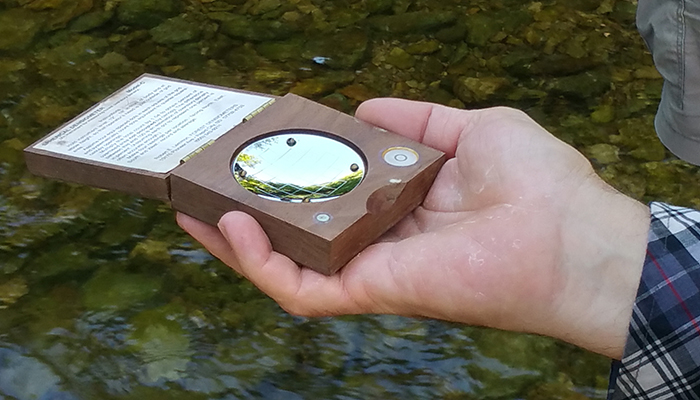
A concave densiometer is used to quantify the amount of tree canopy shading the stream
Annual sediment samples are sent to a lab to analyze for metals, PAHs, pesticides, PCBs (industrial chemicals) and hydrocarbons
EII sampling has been conducted in Austin for over 20 years and provides a rigorous and quality-assured data set that informs our management and priorities in Austin’s streams. The data can show how the creeks are changing and can give us a firm basis for establishing protections and projects to help maintain or improve the integrity of our aquatic resources.
Data from the monitoring is available to the public after it has passed rigorous checks for quality assurance. All up-to-date current quality-assured data is available through our searchable data portal https://data.austintexas.gov/Environmental/Water-Quality-Sampling-Data/5tye-7ray/data Watershed summaries of historical data are periodically compiled to help put this data in context. The most recent summary was produced in 2015 and includes the previous 15 years of EII data. These watershed summaries are available at www.austintexas.gov/department/environmental-integrity-index. Check back later this year for the next summary which will be available as an interactive map-based tool.