
Contract Category Spend
Contract Category Spend
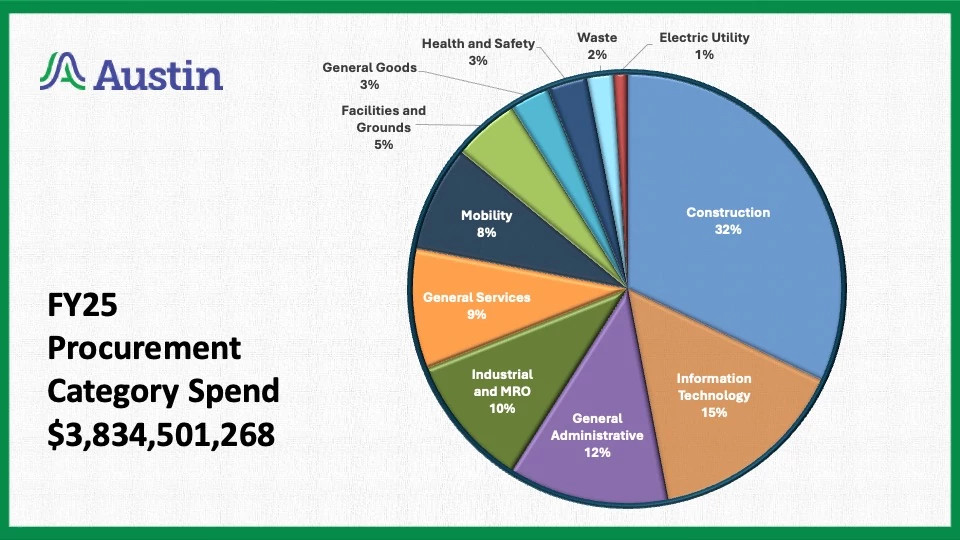
On this page, you’ll learn about what the City of Austin buys and which departments are spending the most in each category.
Category Descriptions
Find out more about each of the eleven procurement categories used by the city of Austin and which departments had the greatest spending in each category, by reading the descriptions provided below. The categories include Administrative, Construction, Electric Utility, Facilities and Grounds, General Goods, General Services, Health and Safety, Industrial and Maintenance, Repair and Operation (MRO), Information Technology, Mobility, and Waste.
Administrative
This category includes interlocal, cultural arts, legal contracts and the contracts authorized by departments outside of Central Procurement. Examples of Administrative Contracts include Legal Service Contracts, Interlocal Contracts and Chapter 380 Contracts. Administrative contracts made up 12% of the City’s overall spending in FY2025.
City Departments/Organizations with the Greatest Spending in this Category:
- Austin Housing Finance Corporation
- Austin Convention Center
- Austin Public Health
- Austin Economic Development
Construction
This category includes City spending for professional services related to construction as well as construction services. Examples include engineering and architectural design services and construction services for Capital Improvement Projects. Construction services made up 32% of the City’s overall spending in FY2025.
City Departments with the Greatest Spending in this Category:
- Austin Water
- Austin Aviation
- Austin Transportation and Public Works
- Austin Watershed Protection
Electric Utility
This category is specific to Austin Energy and includes spending needed to support its operations that are not otherwise included in the other categories. Examples of purchases supporting Austin Energy include transformers, weatherization services and electric vehicle charging station maintenance and repair. Electric Utility purchases made up 1% of the City’s overall spending in FY2025.
Austin Energy is the only department using this procurement category.
Facilities and Grounds
This category includes grounds maintenance, general trades for facilities repair such as plumbing, electrical and HVAC, security systems and all goods and services directly associated with those items. Examples include HVAC systems, pest control, and custodial services. Facilities and Grounds purchases made up 5% of the City’s overall spending in FY2025.
City departments with the greatest spending in this category:
- Austin Water
- Aviation
- Building Services Department
- Parks and Recreation Department
General Goods
This category applies to finished and unfinished goods not associated with another category. Examples include office supplies and paper, furniture and library materials. General Goods spending made up 3% of the City’s overall spend in FY2025.
City Departments with the Greatest Spending in this Category:
- Austin Energy
- Austin Public Library
- Austin Water
- Ausin Aviation
General Services
This category is used for services not related to any other existing category or services not otherwise classified. It is used to categorize services performed by professionals who have specialization in specific areas. Examples include employee benefits, consulting and training, and staffing services. General Services purchases made up 9% of the City’s overall spending in FY2025.
City Departments with the Greatest Spending in this Category:
- Austin Aviation
- Austin Energy
- Austin Economic Development
- Austin Human Resources
Health and Safety
This category includes goods and services necessary to serve the health needs of the community and protect public health. such as medical supplies and testing, disease and injury prevention research, and detecting, and preventing and responding to infectious diseases. Examples of purchases in this category include medical supplies, mental health services and forensics/DNA testing. Health and Safety purchases made up 3% of the City’s overall spend in FY2025.
City Departments with the Greatest Spending in this Category:
- Austin Energy
- Austin Fire
- Austin Police
- Austin Public Health
Industrial and MRO
This category pertains to industrial goods and services, as well as maintenance, repair and operation (MRO) services. Examples of purchases in this category include industrial supply and equipment, building supplies, industrial equipment, asphalt and all goods and services directly associated with those items. Industrial and MRO purchases made up 10% of the City’s overall spending in FY2025.
City Departments with the Greatest Spending in this Category:
- Austin Energy
- Austin Water
- Austin Facilities Management
- Austin Transportation and Public Works
Information Technology
The Information Technology (IT) category includes the use of computer-based information systems to create, store, retrieve, transmit and manipulate data or information. Purchases included in the Information Technology category include hardware, software, services and supporting infrastructure to manage and deliver information using voice, data and video. Examples of purchases in this category include Software as a Service (SaaS), PCs, laptops, and tablets, and IT Staff Augmentation and Consulting. Information Technology purchases made up 15% of the City’s overall spending in FY2025.
City Departments with the Greatest Spending in this Category:
- Austin Energy
- Austin Water
- Austin Aviation
- Austin Information Technology Services
- Austin Financial Services
Mobility
The Mobility Category includes contracts related to maintaining infrastructure including streets, bridges, sidewalks, bikeways, walkways and airport transit systems. In addition, mobility includes acquisition, maintenance and fueling of City of Austin vehicles and equipment as well as the rental of vehicles and equipment. Examples of purchases in this category include fuel, vehicles, bikes, wheeled equipment and towing services. Mobility category purchases made up 8% of the City’s overall spending in FY2025.
City Departments with the Greatest Spending in this Category:
- Austin Resource Recovery
- Austin Water
- Austin Fleet Mobility Services
- Austin Transportation and Public Works
Note: This category does not include construction services for Capital Improvement Projects related to mobility.
Waste
This category pertains to contracts related to waste for the City of Austin. This category includes refuse, recycling and all goods and services directly associated with those items. This category generally supports Austin Resource Recovery. Examples of purchases in this category include composting, recycling, garbage and landfill services. Waste category purchases made up 2% of the City’s overall spending in FY2025.
City Departments with the Greatest Spending in this Category:
- Austin Resource Recovery
- Austin Water
- Austin Watershed Protection
Department Contacts
If you’re interested in connecting with a department that buys what your business sells, reach out to departments directly by accessing the contact information provided in the linked document.