


City of Austin
FOR IMMEDIATE RELEASERelease Date:
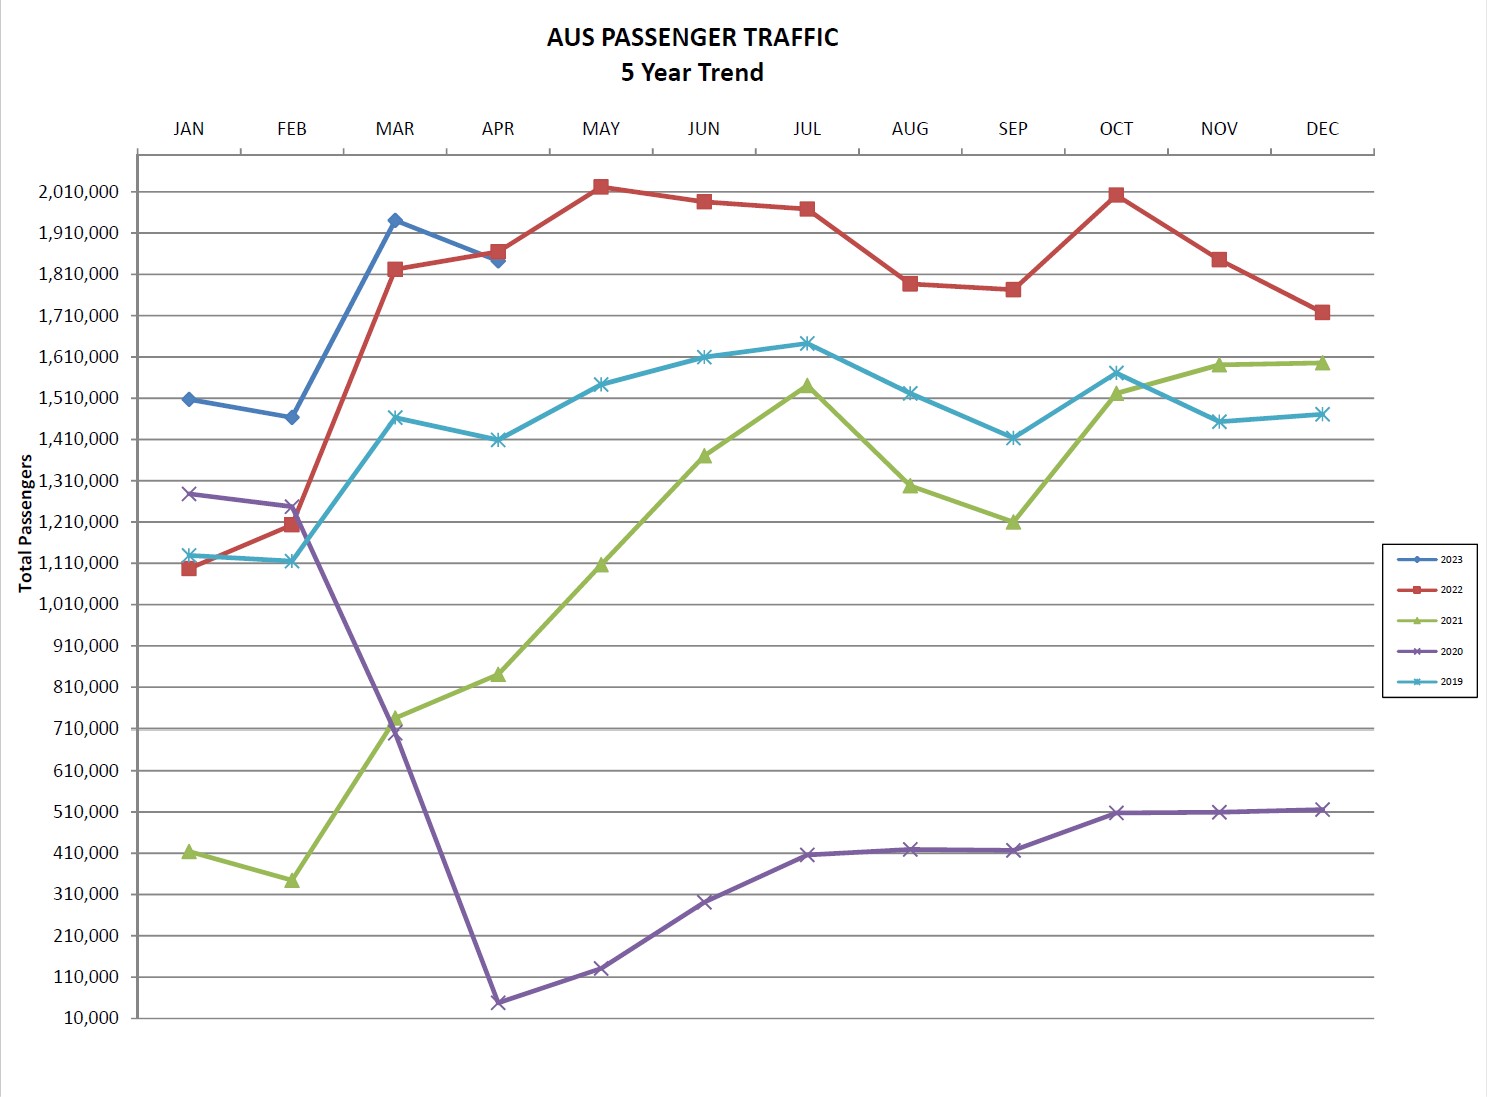
AUSTIN, TEXAS – Austin-Bergstrom International Airport (AUS) passenger traffic growth for April 2023 was down 1.05% compared to April 2022 with 1,845,480 passengers flying during the month.
April 2023
Passenger Activity: Total passenger traffic for April 2023 was 1,845,480, down 1.05% compared to April 2022. April 2023 enplanements totaled 934,029, down 0.95%. Southwest Airlines passengers totaled 712,190, down 1.5%; American Airlines passengers totaled 456,262, down 8.9%; Delta Air Lines passengers totaled 214,802, down 4.0%; United Airlines passengers totaled 200,742, up 8.7%; Alaska Airlines passengers totaled 73,829, down 11.4%; Spirit Airlines passengers totaled 71,203, up 98.1%; Allegiant Air passengers totaled 37,270, up 10.6%; JetBlue Airways passengers totaled 24,108, down 36%; British Airways passengers totaled 15,873, up 37.2%; Frontier Airlines passengers totaled 7,510, down 15.2%; KLM Royal Dutch Airlines passengers totaled 6,186, up 34.2%; Hawaiian Airlines passengers totaled 5,985, up 43.3%; Lufthansa passengers totaled 5,554, up 67.1%; Aeromexico passengers totaled 4,994, up 1.5%; Virgin Atlantic passengers totaled 3,982; Air Canada passengers totaled 3,948, down 1.1%; and Sun Country Airlines passengers totaled 1,042, up 148.1%.
April 2023 air cargo totaled 22,691,170 lbs., down 20.99% compared to April 2022. International air cargo totaled 2,924,445 lbs., up 1.63%. Federal Express carried 6,564,937 lbs., down 11.6%; Air Transport International carried 4,457,382 lbs., down 43.7%; Atlas Air carried 3,157,415 lbs., up 1.7%; and United Parcel Services carried 2,750,439 lbs., down 20.9%.
Air Services transferred 397,210 lbs. of mail, down 43.42%; and 2,738,105 lbs. of belly freight, down 22.25%.
Aircraft Operations: General Aviation operations totaled 4,294, down 4.02%. Combined operations (including commercial and military) totaled 23,023 down 0.23%.
January – April 2023
Passenger Activity: Total passenger traffic for January – April 2023 was 6,757,087, up 12.84% compared to January – April 2022. January – April 2023 enplanements totaled 3,363,788 , up 12.59%. Southwest Airlines passengers totaled 2,607,796, up 14.8%; American Airlines passengers totaled 1,691,819, up 4.0%; United Airlines passengers totaled 757,727, up 23.1%; Delta Air Lines passengers totaled 757,351, up 9.2%; Spirit Airlines passengers totaled 281,659, up 80.6%; Alaska Airlines passengers totaled 266,881, down 2.4%; Allegiant Air passengers totaled 112,223, up 13.7%; JetBlue Airways passengers totaled 79,924, down 32.9%; British Airways passengers totaled 54,922, up 75.7%; Frontier Airlines passengers totaled 33,327, down 24%; Hawaiian Airlines passengers totaled 23,698, up 37.4%; KLM Royal Dutch Airlines passengers totaled 20,513, up 302.9%; Lufthansa passengers totaled 18,994, up 471.4%; Aeromexico passengers totaled 18,637, down 2%; Air Canada passengers totaled 15,170, up 42.1%; Virgin Atlantic passengers totaled 13,944; Sun Country Airlines passengers totaled 2,170, up 87.2%; and National Airlines passengers totaled 332.
January – April 2023 air cargo totaled 97,973,358 lbs., down 4.22% compared to January – April 2022. International air cargo totaled 8,499,869 lbs., up 74.34%. Air Transport International carried 32,715,038 lbs., up 29.9%; Federal Express carried 27,076,548 lbs., down 0.8%; United Parcel Services carried 11,255,380 lbs., down 12%; and Atlas Air carried 7,649,538 lbs., down 49.1%.
Air Services transferred 1,510,359 lbs. of mail, down 41.28%; and 12,214,712 lbs. of belly freight, up 15.30%.
Aircraft Operations: General Aviation operations totaled 16,491 for January – April 2023, down 2.44%. Combined operations (including commercial and military) totaled 88,549, up 3.55%.