Frequently Asked Questions
We have developed a watershed viewer, so it is easy to find out what watershed you live in and to find out its Environmental Integrity Index score.
See the Upcoming Events calendar for Austin-area 2017 Texas Native Plant Week activities
- The Grow Green plant guide features many Texas natives and is available in downloadable and searchable database formats.
- Plant a native tree in your yard or at your place of business.
- Volunteer at a Native Plant Week event! See calendar postings for details.
- Attend native plant events, plant sales and educational presentations.
- Take a tour of the Grow Green Demonstration gardens (Biking and driving map)
- Plant a native garden for butterflies, hummingbirds and other wildlife.
- Join us on Facebook and Twitter
- Lady Bird Johnson Wildflower Center Texas Native Plant Week activities
On June 16, 2009 Governor Perry signed a bill into law that recognizes the third week in October as Texas Native Plant Week. The bill is intended to emphasize the role of native plants in conservation efforts and to be used as incentive for the Texas education system to teach school children about the importance of native plants. The Native Plant Society of Texas teamed with State Representative Donna Howard to present the bill to the State Legislature. The bill passed unanimously in both houses.
Neem Oil
Active ingredient: Extract of hydrophobic neem oil
• Natural 3 in1 product kills many insects, spider mites and fungal leaf problems
• Oil-based product so to avoid leaf burn, apply during cool times of day
• Do not apply when bees are active
• Do not apply to stressed plants
Insecticidal Soap
Active ingredient: Potassium or sodium salts of fatty acids
• Helps break down body of soft-bodied insects like aphids, whiteflies, spider mites, immature scale
• Similar to dishwashing soap, but without perfumes or dyes that may cause plant tissue damage
• May need repeated applications
Horticultural Oils
Active ingredient (varies by brand): Canola oil, light weight petroleum, and paraffinic oils
• Smothers the insect
• Different oils are temperature specific; some must be used on dormant plants, others can be used at warmer times of year, read label for details
• Water plants thoroughly before applying to make sure the plant is not under moisture stress
• Is toxic to fish. Do not apply near water
Pest caterpillars: Bt, Thuricide
Active ingredient: Bacillus thuringiensis subspecies kurstaki
• Must be ingested by the insect so be sure to thoroughly spray foliage
• Apply when pest caterpillars first appear
• Caterpillars should stop feeding within a few hours but may take a few days to die
• Does not kill beneficial insects
• Breaks down in sunlight after about a week
• Product contains live spores of a bacteria that infect the pest, so store in a cool dry place
• Shelf life - will lose potency after 2 – 3 years
Mosquito larvae: Mosquito Dunks
Active ingredient: Bacillus thuringiensis var. israelensis
• Kills the swimming larval stage of mosquitos
• Not to be used in drinking water
• Won’t hurt fish
• Available in granular form for small areas like bird baths; bigger dunks available for larger bodies of water
• Product contains live spores of a bacteria that infect the pest, so store in a cool dry place
• Shelf life - will lose potency after 2 – 3 years
Shoal Creek Restoration 15th - 28th
- Project Schedule
- Phase 1 Construction Map
- Phase 2 Construction Map
- Phase 3 Construction Map
- Phase 4 Construction Map
- Project Overview
- Park Use Integration Plan
- Existing Creek Erosion
- Creek Stabilization
- Bank Stabilization Photo Simulation 1
- Bank Stabilization Photo Simulation 2
- Creek Crossing Photo Simulation
- Water Quality Enhancements
- Vegetated Swales Photo Simulation
- San Gabriel Biofiltration Pond
- Riparian Restoration A (Pedestrian Bridge to Volleyball Courts)
- Riparian Restoration B (Volleyball Courts to 24th Street)
- Riparian Restoration C (24th Street to Gaston Blvd)
- Riparian Restoration Photo Simulation
- Trail and Park Access Improvements
- Lamar Bike Trail at 24th Street Photo Simulation
- Wastewater Line Relocation Features
- Proposed Manhole Locations
Development is not allowed to cause additional flooding to other properties. Any time impervious cover is increased, there is the potential for increased stormwater runoff. Impervious cover includes roofs, parking lots, streets, driveways and other areas where the landscape cannot absorb rainfall. To combat this problem, the City of Austin requires all new developments to ensure that they will not adversely impact downstream properties. Developers are required to either provide on-site flow controls or pay fees for regional flood control projects.
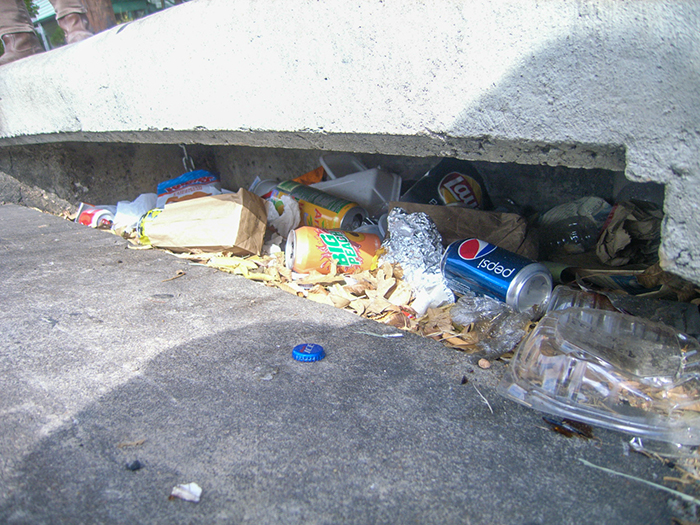
El agua de la lluvia arrastra la basura al punto más bajo – a los arroyos o a los lagos. La basura es el contaminante más grande y más visible de nuestros arroyos en la ciudad.
- Causa contaminación (la descomposición del plástico, colillas de cigarrillos, baterías, aceite de motor, pintura y cualquier otra basura tóxica)
- Disminuye los niveles de oxígeno al pudrirse en el arroyo
- Destruye los hábitats acuáticos
- Daña a los animales que viven en el agua
- Disminuye el valor de las propiedades
- Atrae otro tipo de crímenes
- Le da mal aspecto a la ciudad
- Le cuesta dinero a los pagadores de impuestos para que se limpie la Ciudad
El viento y la lluvia llevan los contaminantes al arroyo o al lago, los cuales son los puntos más bajos del área. La basura es el contaminante más grande y visible en los arroyos urbanos.
About Watershed Protection
A watershed is the area of land that drains to a particular location. In Austin, watersheds typically refer to the land draining to one of our larger creeks.
A watershed is the area of land that drains to a particular location. In Austin, watersheds typically refer to the land draining to one of our larger creeks.
Adopt a Storm Drain
Waste:
- Pick up and dispose of pet waste properly.
- Do not leave bagged poop on trails. During rain events it will flow directly to nearest waterway.
- Do not put leaves, cut grass, and other yard waste in or near storms drains.
Vehicles:
- Fix vehicle leaks
- Dispose of used motor oil and other car fluids at your local service station or the Household Hazardous Waste Facility (512)974 -4343
- Wash your vehicle where soap and water flows into grass, not the street, or use a carwash.
Lawns:
- Use fewer fertilizers, pesticides, and weed killers in your yard
- Plant native plants that will not need as much water and fertilizers.
Trash:
Start a fun habit of picking up 3 pieces of trash per day. 75% of trash in waterways came from land. Large trash can block storm drains causing flooding. For removal of bulky trash call 3-1-1.
NO. In Austin, the systems are separate and whatever enters the storm drains is discharged directly into a local creek, stream, river or lake not to a sewage treatment facility.
- Storm Drain Marking Volunteer Program
- Scoop the Poop Education
- Adopt A Creek https://keepaustinbeautiful.org/programs/adopt-a-creek/
- Sign up to receive a once a month email about volunteer opportunities in building Rainscapes, Grow Zones, Invasive Plants removal, and/or collecting aquatic macroinvertebrates here
- Report Pollution and Dumping to our Pollution Prevention Hotline (512)974-2550
Available anytime 24 hours a day 7 days a week
- Adopt a drain programs raise citizen awareness and empowers Austinites to take positive actions on behalf of their local waterways.
- People do not realize that “natural” debris like leaves, grass clippings, fertilizer or pet waste become pollution when they enter the water. Decaying leaves and grass release nutrients into the water that feeds excess growth of algae. Algae makes the water green and soupy, blocking sunlight and oxygen to native plants, fish, and wildlife that live on the bottom. When algae dies it creates a dead zone.
- Street flooding can be caused by and made worse by clogged drains.
- Educating your neighbors and volunteering with friends and family is fun!
Austin Invasive Plants Management
The National Invasive Species Council, established by Executive Order 13112 in 1999, defines invasive species as species that are: “…nonnative (or alien) to the ecosystem under consideration and whose introduction causes or is likely to cause economic or environmental harm or harm to human health.”
A “non-native” (or “alien”, “exotic” or “nonindigenous”) species is one that has been introduced by human action, intentionally or accidentally, into an ecosystem in which it did not previously occur. Introductions occur along a variety of pathways, or vectors, such as through commercial trade of a species or by accidental means. Invasive species can be plants, animals and other organisms (e.g., fungi).
An invasive species grows, reproduces and spreads rapidly, establishes over large areas and persists. In general, species that become invasive succeed due to favorable environmental conditions and an ability to grow and reproduce rapidly where resource availability is high (Daehler 2003). As invasive species spread and dominate ecosystems, they decrease biodiversity by displacing native plants and animals (Texas Invasives.org).
Thus, the definition of invasive used here has two components: 1) nonnative status and 2) the ability or potential to cause harm. It is important to note that not all nonnative species are considered invasive because many do not, or are not likely to, cause economic or environmental harm or harm to human health (Williamson 1996). Many non-native species support human livelihoods or a preferred quality of life. Examples include most crops and a number of exotic ornamentals (IASC 2006). Conversely, in some situations native species can cause economic or environmental harm or harm to human health. Examples include the economic impact of mesquite (Prosopis glandulosa var. glandulosa) spreading through a Texas rangeland, Ashe juniper (Juniperus ashei) altering the hydrology of the Hill Country or a painful rash caused by poison ivy (Toxicodendron radicans) growing along Lady Bird Lake. While these species can cause problems, and do require management, they are not considered invasive because they are native to these particular ecosystems.
Book 1 - Invasive Species Management Plan
Book 2 - Field Resources, Invasive Species Management Plan This is a working document that can be used to plan restoration activities that involve invasive plant management. It has basic information about different types of controls and field methods and includes a review of the most common invasive species in the Austin area, broken down by Woody Plants, Grasses, Herbaceous Plants and Aquatic Plants. Some of these reviews are fairly robust, while others are pretty sparse. We intend to update these annually, so would appreciate any feedback and “field stories” that would improve this guidance document. Please email feedback to John Clement
The Austin City Council passed a resolution on April 8, 2010 directing the City Manager to develop an Invasive Species Management Plan to guide efforts to minimize the harmful environmental and economic impacts of invasive plant species on city-managed properties. Subsequent to that resolution an agreement with the Lady Bird Johnson Wildflower Center led to creation of a working group with representatives from several City departments, Austin Parks Foundation, Keep Austin Beautiful, Texas Parks and Wildlife and the Austin Invasive Species Coalition. Over the course of ten consensus-based meetings, the Working Group developed strategic five-year goals based on a central framework of prevention, early detection-rapid response and long-term control at prioritized sites. The plan also includes recommendations for implementation including staffing, funding sources, centralized mapping and monitoring, and education and outreach. To improve the plan’s success, the working group has developed a preliminary list of priority invasive species and an invasive species resource manual with identification fact sheets and best management practices to control priority species.
The City of Austin Invasive Species Management Plan was developed in collaboration with multiple non-profits and departments.
Austin Energy
Austin Invasive Species Coalition – represented by American Youthworks Environmental Corps
Austin Parks Foundation
Austin Water Utility
Keep Austin Beautiful
Lady Bird Johnson Wildflower Center
Parks and Recreation Department
Planning and Development Review
Texas Parks & Wildlife
Watershed Protection Department
Only licensed pesticide applicators who are City of Austin staff or contractors may use pesticides on City property.
Learn more about riparian restoration techniques, including but not limited to invasive species removal in the frequently asked section of www.austintexas.gov/creekside .
Weed wrenches are available to check out from the Austin Parks Foundation and Keep Austin Beautiful.
When a species ends up in a new ecosystem, it is considered "introduced". Often, invasive species are spread by humans who do not realize that these plants, animals and insects are highly destructive.
This may happen, for example, when people plant garden ornamentals, range forage plants for cattle, or plants used for erosion control and habitat enhancement for wildlife. This can also occur when animals and insects are introduced to be used to control other organisms (particularly in agriculture).
Other species are introduced accidentally on imported nursery stock, fruits, and in ship ballast waters, on vehicles, in packing materials and shipping containers, through human-built canals, and from human travel. Dumping aquarium exotic fish and unwanted exotics into the water or wild are other common ways invasive species spread.
Austin Lakes Index
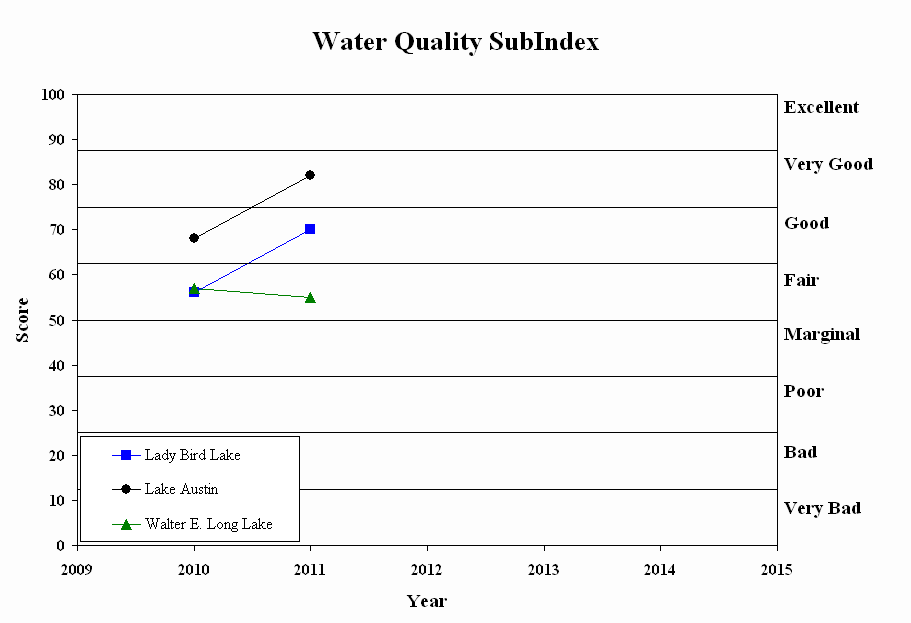
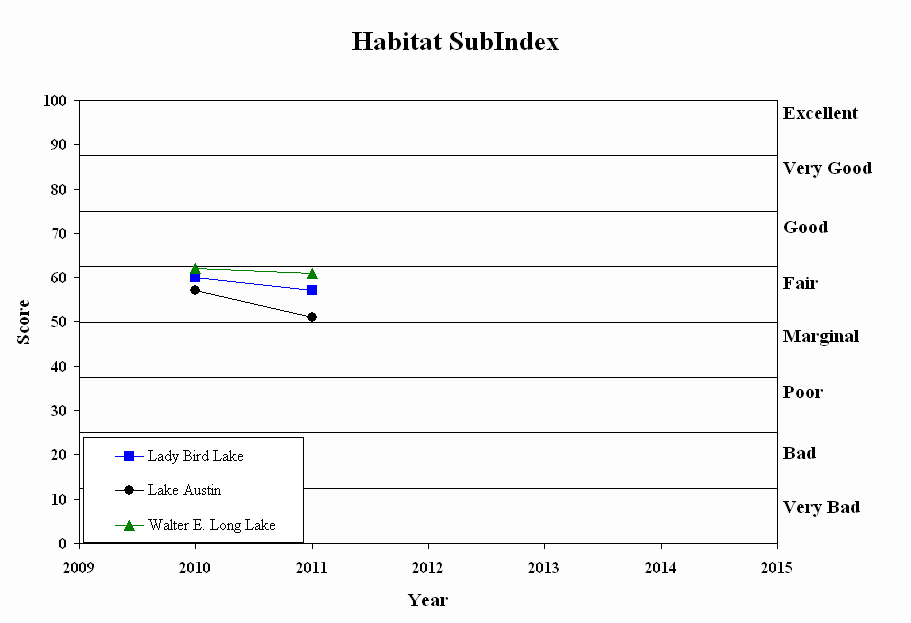

All three lakes are manmade reservoirs, Lady Bird and Lake Austin are flow-through reservoirs on the Colorado River, and Lake Long is a cooling reservoir for the Decker Creek Power Station.
Lady Bird 471 surface acres, 5 miles long Created in 1960 as an impoundment of the Colorado River with the completion of Longhorn Dam Originally named Town Lake, renamed Lady Bird Lake in 2007 to honor Lady Bird Johnson Operation and flow Flow-through reservoir (little storage capacity), typically has two ‘seasons’
- Mar-Oct has higher flows, more river-like as LCRA passes water through to downstream rice farmers
- Oct- Mar has lower flows, more lake-like as water is stored in Lake Travis for use during irrigation season
Beginning in 2012, the flows became less variable, as LCRA has restricted irrigation releases during the historic drought.
Reservoir uses
Lady Bird used to be a source of public drinking water and also was a cooling reservoir for the now-decommissioned Holly Power Plant (Future: Holly Shores project) Currently, the lake is primarily used for non-motorized recreation (canoeing, kayaking, competitive rowing, paddleboarding) as well as providing refuge for a wide variety of birds and urban wildlife. It is also a great spot for fishing, whether from the shore or on the water (gas motors on your boat! Check out TPWD’s web for more details Lady Bird’s Hike and Bike Trail.
Lady Bird's Hike and Bike Trail is an important recreational ‘get away’ for both Austinites and visitors.
Lake Austin
1600 surface acres 21 miles long Created in 1940 as an impoundment of the Colorado River with the completion of Tom Miller Dam Operation and flow Flow-through reservoir with little storage capacity, typically has two ‘seasons’:
- Mar-Oct has higher flows, more river-like as LCRA passes water through to downstream rice farmers
- Oct- Mar has lower flows, more lake-like as water is stored in Lake Travis for use during irrigation season In 2012, the flows became less variable, as LCRA has restricted irrigation releases during the historic drought.
Reservoir uses
Current uses include generation of hydroelectric power at upper (Mansfield) and lower (Tom Miller) dams, conveyance of flood and irrigation water, multiple public and private drinking water intakes, including two owned by City of Austin (Ullrich and Davis Water Treatment Plants). Several parks and public boat ramps provide public access, check this link for more information.
Important recreation destination for water sports and sport fishing, with trophy sized large mouth bass. For more information on fishing Lake Austin, check TPWD’s webpage.
Lake Walter E. Long 1,269 surface acres Created in 1967 as a cooling reservoir for Decker Creek Power Station, it impounds Decker Creek. City of Austin owns the lake and entire shoreline Public access (park and boat ramp) on the southeast shore, click here for more details Insert link to PARD Lake Long site: http://www.austintexas.gov/page/lake-walter-e-long
Important recreational resource, Walter E. Long Park (link) with healthy sport fish communities. . For more information about fishing at Lake Long, check TPWD’s webpage.
Operations and flow: Up to 680 million gallons of water per day is pulled in from the Colorado River to the southwestern arm of the reservoir and used as cooling water for the power plant. This warmer water is discharged into the northeast arm, losing heat as it flows through the reservoir, back to the southwest area. The lake level is maintained by pumping water from the Colorado River at an average rate of 16,156 acre feet/year. Austin Energy then releases 500 gallons per day to maintain flow through the lake and in Decker Creek downstream of the lake. Lake water quality: This river water is high in nutrients, and this combines with the warm water from the power plant to limit the lake’s water quality, regardless of the healthy riparian zone provided by the preserve and parkland along its shores. The increased nutrients, warmer water temps and longer retention time often leave the lake vulnerable to algal blooms through out the year.
There are six categories of data collected and used to calculate sub index scores:
- Water Quality
Collected at the surface and bottom of the lake
- Nutrients (Nitrate-N, Ammonia-N, and Orthophosphorus)
Collected only at the surface
- Total Suspended Solids
- E coli bacteria
Collected along a depth profile
- Conductivity
- pH, temperature and dissolved oxygen are also collected but are not part of scoring
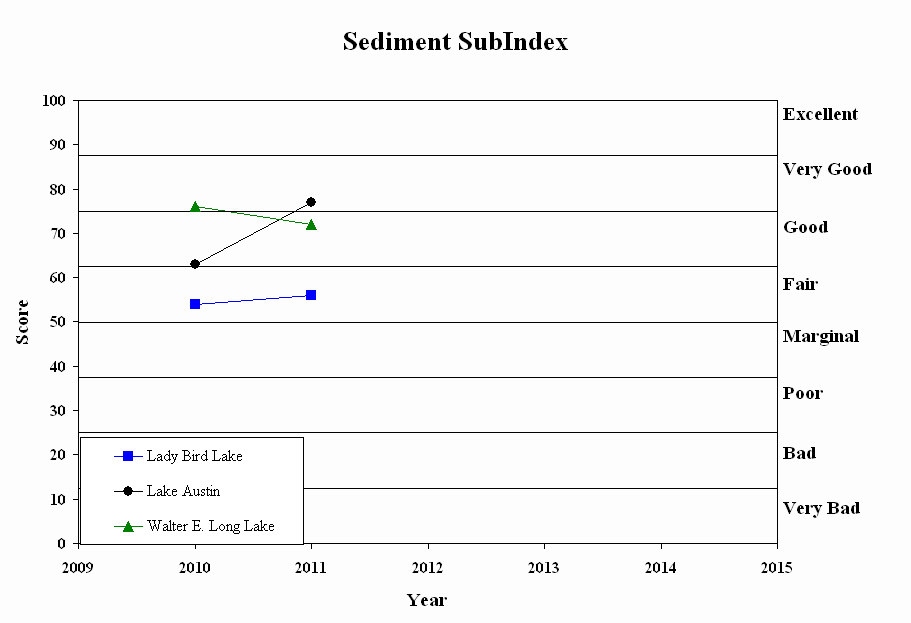
2. Sediment Quality
Sediment Chemistry
- Sampled at the deepest point of each lake near the lower dam.
- Shows the accumulation of material from the lake’s watershed
- Metals, PAHs, pesticides and herbicides
3. Habitat Quality-
Visual assessment based on EMAP protocol
- Riparian zone plant density, community structure, and width
- Shoreline characteristics
- Aquatic cover and substrate characteristics
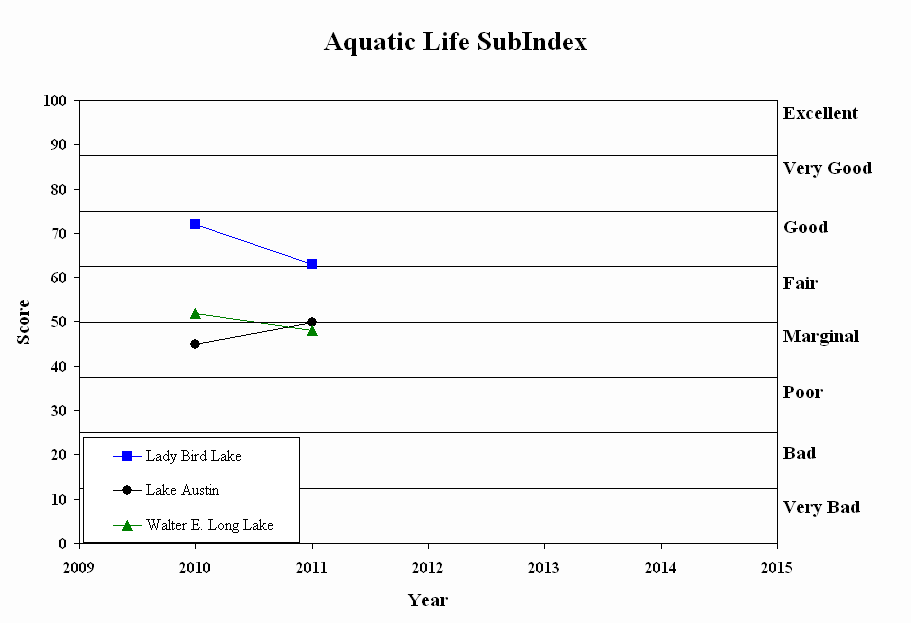
4. Aquatic Life
Benthic Macroinvertebrate Community
- 7 metrics assessing: Diversity, Pollution Tolerance, and Community Structure
- Evaluates lake health beyond single ‘snapshot’ of water chemistry sample
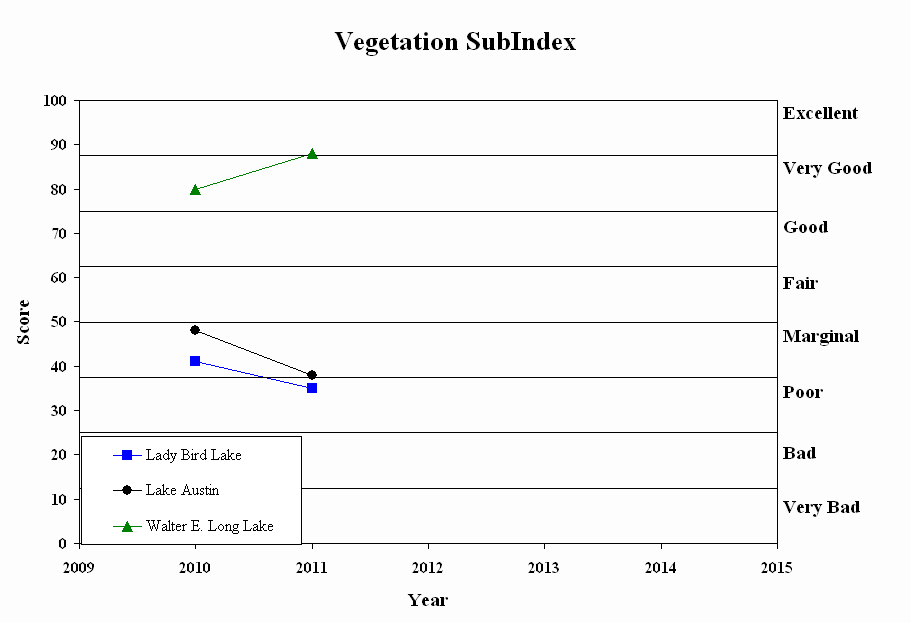
5. Vegetation
Surveys performed by Texas Parks and Wildlife Department
- 3 metrics assessing: Percent coverage, Diversity, and Community Structure, including invasive species cover
- Total acreage of all plant species
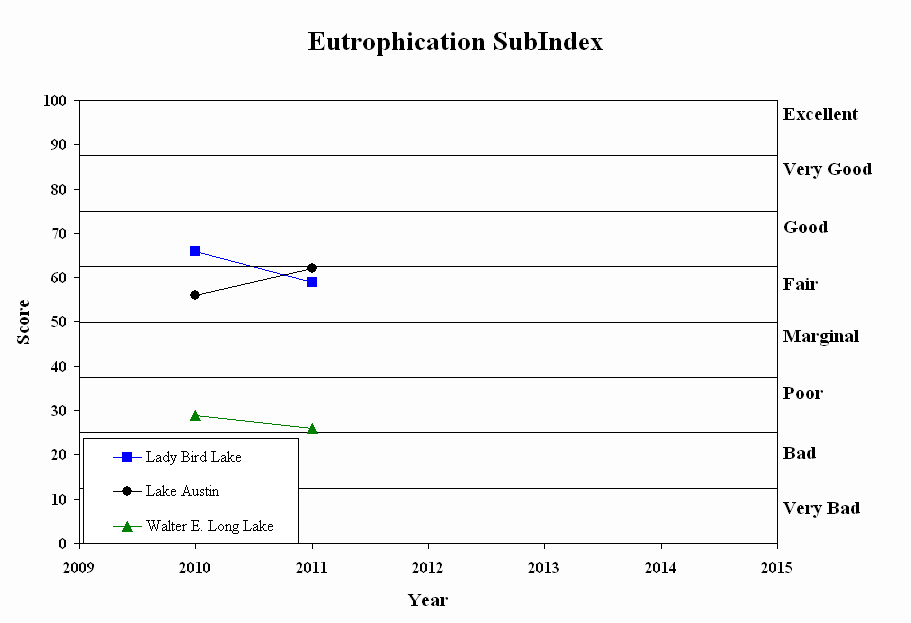
6. Eutrophication
Phytoplankton community
- 3 metrics assessing: Phytoplankton abundance, Pollution Tolerance, and Community Structure
- Evaluates lake health and nutrient loading beyond single ‘snapshot’ of water chemistry sample
A more complete description of the parameters and methods are provided in the Lake Index Methodology.
A general summary of current scores on each lake can be accessed at ATX Find Your Watershed.
For all lakes:
- Sediment is collected from the substrate at the bottom of the lake near the downstream dam on each lake
- Habitat data are collected at 10 evenly spaced sites throughout the lake
- Benthic macroinvertebrates (Aquatic Life score) are collected in shallow water at 3,5, and 6 of the 10 habitat sites on Lady Bird Lake, Lake Austin, and Lake Long respectively.
- Vegetation scores are based on TPWD surveys that map all the aquatic plants in each lake
-
Water quality and phytoplankton (Eutrophication score) samples are collected at the surface and bottom at 3 sites on each lake:
- Lady Bird Lake
- Near Longhorn Dam in the Basin
- Downstream of 1st Street Downstream of Redbud Isle
- Lake Austin
- Near Tom Miller Dam
- Emma Long Metropolitan (City) Park
- Low Water bridge
- Lake Long
- SW arm
- NE arm
- Near the dam
Austin's Reservoir Resource
Algae blooms received a lot of press the summer of 2014 thanks to the massive cyanobacterial blooms in Lake Erie, one of which resulted in the city of Toledo having to stop providing water to the city. In Lake Austin, where the city of Austin derives its drinking water, algae blooms and associated taste and odor problems are closely monitored. The summer of 2014 we saw a larger than normal diatom algae bloom (Fig. 1). However, diatoms are typically harmless and generally do not adversely impact drinking water supply. As with previous years (Fig. 2), in late summer and through the fall we saw the biomass of cyanobacteria increase in lower Lake Austin (Fig. 1). As of January 2015, scientists are analyzing the species composition of the cyanobacteria assemblage to determine if organisms capable of producing toxins are present. But, the bloom was nowhere near the magnitude experienced by the coastal communities of Lake Erie in 2014, and was less than 60% as large as the bloom experienced in the Lake Austin Reservoir in 2013 (Fig. 2). Of interest though was the fact that the cyanobacterial bloom lasted longer in the summer and fall of 2014 than in previous years.
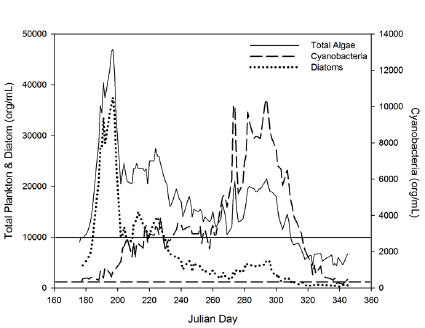
Figure 1. Total algal and Diatom biomass (cells/mL; left axis) and Cyanobacterial biomass (cells/mL; right axis) for the period June 28 through January 11th, 2014 (more data will be added). Austin Water Utility recognizes and monitors a phytoplankton bloom when the total cell count is > 10,000 org/mL (solid horizontal line) and a cyanobacterial bloom is triggered at a count > 300 org/mL (dashed horizontal line).
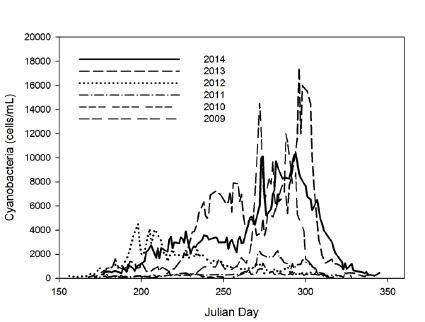
Figure 2. Algal biomass (cells/mL) based on total cell counts (A); diatoms (B); and cyanobacteria (C) for the summers from 2009 to 2014.
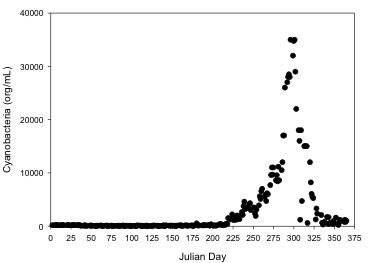
As Central Texas emerged from drought conditions late in 2015 into 2016, the 2017 summer has seen a return of large discharges through the Highland Lakes similar to the pre-drought period (i.e., pre-2009). The Highland Lakes were nearly at 100% capacity late in 2015 due to major rain events. Through most of the mid-to-late summer period, discharges were generally low, enabling a long duration (~4 month), large magnitude (~35,000 org/mL), cyanobacteria bloom to develop (Fig 3).
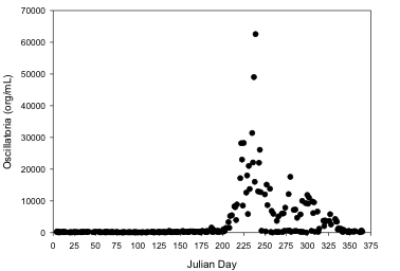
With the Highland Lakes full into 2016, large hydrological pulses to meet downriver agriculture demands occurred throughout the spring and early summer, influencing cyanobacteria bloom dynamics. A large bloom developed earlier than normal as discharges through Lake Austin declined, but the bloom rapidly peaked and crashed, and the total number of bloom days was only 106 days (Fig.4)
In 2017, we have seen large discharges from Lake Travis for most of the summer, until Hurricane Harvey moved into the region. As such, in Lake Austin, as of early November (typically past the peak date of cyanobacteria bloom conditions), less than 30 days have been in a bloom condition, consistent with predictions based on persistent large early- and mid- summer discharges from Lake Travis through Lake Austin.
Visit the Austin Lakes Index webpage.
The logs you see on the shoreline are made of “Coir” and have been placed with plantings for erosion control and lakeshore habitat.
Coir is the natural fiber found in ripe coconut husks, and it has been used for centuries to make ship ropes due to its durability and resistance to water damage. One of the modern uses for coir includes mats or logs of coir fiber bound by coir ropes for erosion control. Coir is anchored in areas with loose soils that need stabilization including stream banks, wetlands and construction sites. The advantage of using coir logs for erosion control (rather than rocks or bulkheads) is that the coir allows vegetation to grow within it as it slowly biodegrades becoming part of the matrix of the soil. When the coir has finally biodegraded (years later), the roots of the vegetation then provide the long-term stability of the soil which provides natural and beneficial integrity to the land and water.
Although appealing in its low cost, durability and ability to biodegrade, it was unclear if coir logs would be successful in stabilizing the shoreline of Lake Austin due to the intense wave energy from recreational boating. A pilot study to test this method in Lake Austin was initiated in Summer 2009. After 5 years of observation, it was determined that coir logs and plants can be successful (under certain circumstances) in stabilizing and restoring a shoreline to a more natural state. Most coir logs deteriorated slowly and the remaining fiber has roots and stems growing throughout. The pilot study provided valuable information regarding placement, location, timing and plant species.
The Watershed Protection Department has recently installed an additional ~2,000 feet of coir logs and plantings along shorelines managed by the City and County. The sites are currently greatly impacted by erosion and the effort may slow down erosion long enough to develop a resilient vegetation community benefiting both stability, habitat and water quality.
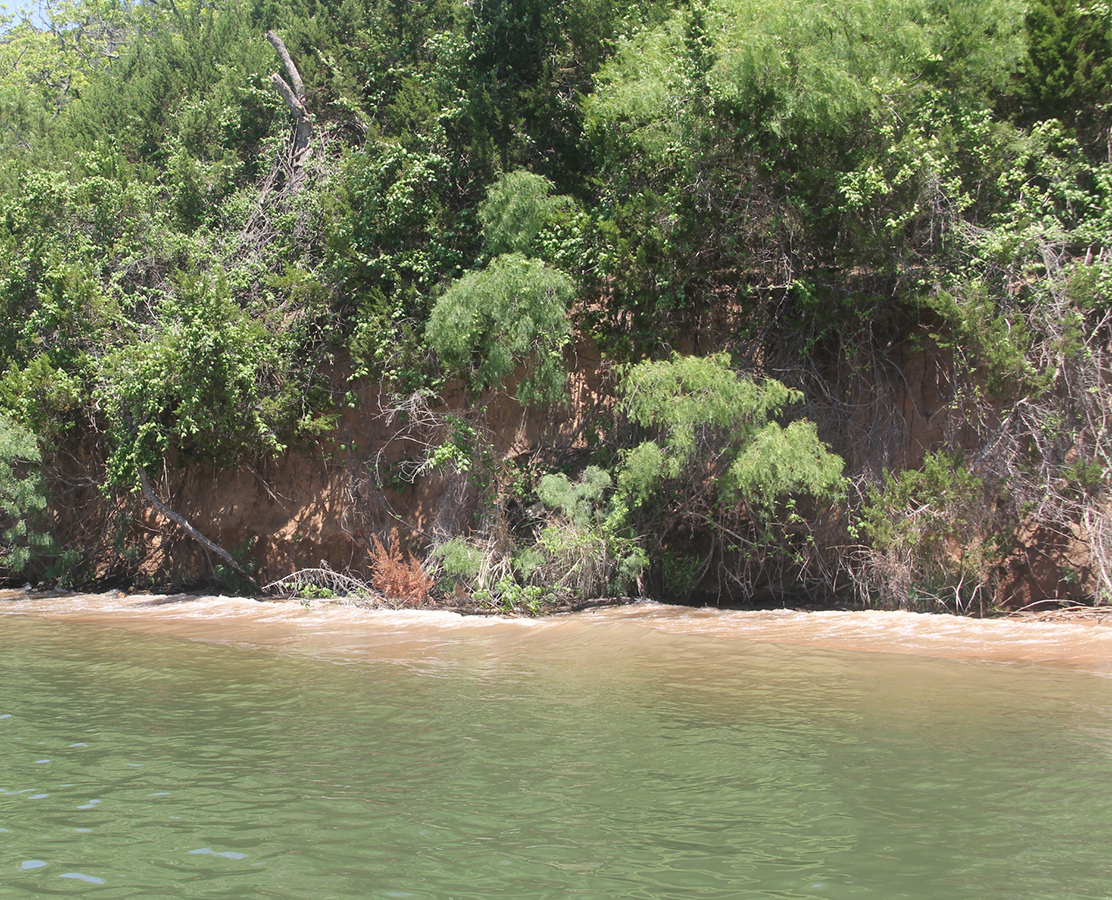
An eroding bank of Lake Austin

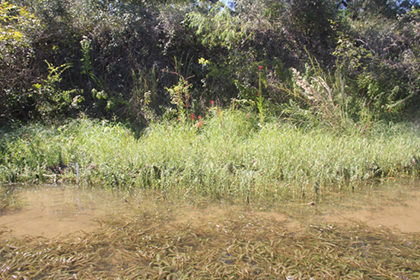
Newly placed coir logs and plantings along shoreline
Coir logs and plantings 4 years after installment
Ecosystem services, stated simply, are the benefits humans derive from the environment. Food, clean air and water, fiber for clothes….these are obvious and significant examples of supplies upon which we are dependent. What keeps the water and air clean? How can the land keep providing food to feed billions of people? Why am I happier when out in ‘nature’? Is my home worth more because of its proximity to a resource (e.g., lake, river, park, forest)?
Turns out, the environment is providing more for us then we tend to think about. The myriad processes that occur ‘outside’ give rise to the services we need and desire. Scientists have grouped the activities and products of nature into four categories: First, Provisioning Services. These are the services we are most familiar with (and grateful for) such as food, potable water, wood and fiber, and fuel. Then, we have the Regulating Services. These occur on a scale that may be imperceptible, when things are good, but relate to services very important to us including flood regulation, water purification and quantity, and disease regulation (think Ebola). Those services are still pretty tangible (and relatively easy to monetize). Services for which we have an innate desire are the Cultural Services. These include having a spiritual connection to nature, enjoying the aesthetic quality of the environment, and of course recreational activities (boating, hiking, camping, etc). Probably the most overlooked but important of all the Ecosystem Services provided by nature are what are known as the Supporting Services. The supporting services are the processes and functions of nature that give rise to all the other services listed above. We desire breathable air, plentiful food, and fiber, so we plant trees and shrubs that take up carbon dioxide and provide raw materials and fruits for consumption. Nutrient cycling mediated by plants and microbes help keep our water clean, our food nutritious (high in nutrients and other compounds), and slow climate change. A diverse, species rich landscape full of animals and plants gives us a sense of peace and fulfillment. Without nature and the environment doing what it does through the Supporting Services, we would not have the other services of interest. It is for the protection and sustainability of the environment that the Supporting services are so often studied by scientists and at heart, our regulations and protections are in place (e.g., minimizing nutrient pollution, deforestation, impervious cover). As human populations increase, our footprint on the landscape grows, and our need for ‘natural capital’ becomes greater to support mankind, it will be the protection, regulation, and protection of the Supporting Services that will ensure sustainability of all Ecosystem Services required and desired for the wellbeing of mankind.
Download a fact sheet about this project.
The City of Austin Watershed Protection Department sincerely appreciates concerns about the fishing resources of Lake Austin. City of Austin staff are coordinating directly with Texas Parks and Wildlife (TPWD) biologists to address concerns relating to the status of the fishery in Lake Austin. The City of Austin and TPWD are actively monitoring conditions in Lake Austin. Both the City of Austin and TPWD believe through combined natural recruitment, mortality of sterile grass carp, and enhancements that may be possible as a result of on-going City research efforts, the vegetation and bass fishery will recover.
Unfortunately, Lake Austin has experienced a fast decline in aquatic vegetation habitat. We were hoping for a more controlled decline, but other factors combined with the sterile triploid grass carp stocking led to the current low level of aquatic vegetation in the lake. Grass carp management has been studied for many years. The approach applied to Lake Austin was a replication of published scientific studies. For a decade we used a conservative incremental stocking rate which combined with a scientifically reported mortality rate avoided overstocking, allowing for continued fish habitat persistence. When extreme drought effects led to the rapid expansion of Hydrilla to more than 600 acres, the rate of fish stocking was increased to ensure the primary functionality of Lake Austin – water supply and flood protection – was not compromised. Our objective remains finding a medium where all lake use interests are met, including the anglers. The Lake Austin fishery is not doomed, and will recover.
For many years Lake Austin has provided excellent conditions to support a quality bass fishery with high trophy potential. Water temperatures, aquatic habitat, Florida largemouth bass stockings and responsible anglers are the reason for the success of this fishery. However, creating a trophy fishery takes more than just Hydrilla. It takes regulation, outreach, genetic stockings, habitat management, and the help of Mother Nature. The interests of anglers, boaters, skiers, swimmers, home owners, consumptive water rights, and operating infrastructure must be all considered equally.
While the explosion of Hydrilla temporarily amplified the great fishing at Lake Austin, it hindered other interests. For example, the last time Lake Austin had a heavy biomass of Hydrilla during a flood event the lake could not serve its purpose of flood control properly and millions of dollars in damage were caused to shoreline properties and the Tom Miller Dam. Excessive Hydrilla also causes safety concerns related to boating and swimming.
Aquatic vegetation challenges have existed in Lake Austin since the 1950’s, with Hydrilla being the most recent concern beginning in 2002. A partnership between TPWD, LCRA, City of Austin, and the Lake Austin home owners was developed to address this issue. The bass anglers at that time were asked to organize and delegate a representative to partner, but no one was
Control measures were put into effect to prevent potential detriment impacts caused by excessive Hydrilla growth. It was determined that Hydrilla was to be controlled through Triploid Grass Carp stocking to protect multiple user interests. TPWD is the agency responsible for permitting and regulating the stocking rates for Grass Carp in Lake Austin. As the Hydrilla aggressively expanded and impacted primary reservoir functionality and safety, we were forced to slowly increase stocking rates to 54 fish/acre of Hydrilla before we were able to see control. That resulted in the highest number of Grass Carp ever in Lake Austin. Chemical treatment for this type of coverage was not an option and mechanical harvesters could not keep up with growth and can exacerbate spread of Hydrilla.
The increased stocking rate did result in unintended significant fish habitat reduction in 2014. Additionally, untimely scouring, cool temperatures this past winter, continued drought, and altered hydrology have all resulted in a shift within this artificially created and highly regulated system to an alternative state dominated by planktonic algae rather than submersed vegetation. Throughout this summer and fall, short heavy rains have exacerbated the turbidity of Lake Austin through inputs from overland flow and tributaries. However, the current turbid condition of Lake Austin is temporary. There are still numerous propagating sources for native vegetation, protected by cages managed by the City of Austin. As the grass carp population is reduced through natural mortality, vegetation will re-colonize the lake and once again produce clear water conditions.
As published mortality rates of grass carp are estimated at 33% mortality per year, no organized grass carp harvesting effort is necessary or would be the most effective use of City resources. As the Grass Carp population shrinks and native vegetation and Milfoil expands, we should see the fishery recover. Should Hydrilla return in excess amounts in the future, it will be necessary to utilize grass carp again as a control agent. Thus, the stocking permit should not be eliminated especially given the difficult and lengthy process involved in procuring the permit initially.
Given our interest in the recreational as well as municipal use needs of Lake Austin, below is a brief list of efforts TPWD and the City of Austin are utilizing to understand the impacts of Grass Carp on this unique system and work towards system recovery.
- We will continue to monitor aquatic vegetation habitat quarterly to see what changes occur.
- We are studying trophic changes in the fishery food web as it relates to the changes in the plant community.
- TPWD will continue to stock Florida largemouth bass as needed to keep the growth potential strong at the lake.
- TPWD will continue to perform annual electrofishing surveys to monitor fish populations in relation to habitat changes.
- We will continue to support efforts to establish native aquatic vegetation in the lake with the use of cages.
- We will work closely with the water management authorities to advise on best management practices that would also consider the interests of our anglers.
- We will keep the public informed of our progress on these and other topics.
We urge anglers to organize groups to represent their interests at meetings. The group can even become a chapter of Friends of Reservoirs (www.waterhabitatlife.org) and help us enhance fisheries habitat at Lake Austin and other area lakes. TPWD has done so with other groups on Canyon, Buchanan, LBJ, Inks, Granger, and Georgetown lakes. Please share this message with the anglers at Lake Austin.
Please contact Dr. Brent Bellinger (email), 512-974-2717) with the City of Austin if you would like to discuss this further. Thank you for sharing your concern, and for your support to protect Lake Austin.
The Austin reservoirs are in a constant state of flux. Natural and anthropogenic forces influencing the chemical, biological, and physical characteristics of Lake Austin and Lady Bird Lake include: altered flow regimes dictated by water availability, increased development, and introductions and control of species. Each reservoir is cherished for their aesthetic, recreational, commercial, and municipal benefits. In order to balance the needs of such different users while sustaining an ecologically desirable ecosystem, it is essential to understand the relationship between water chemistry and biological structure of the reservoirs.
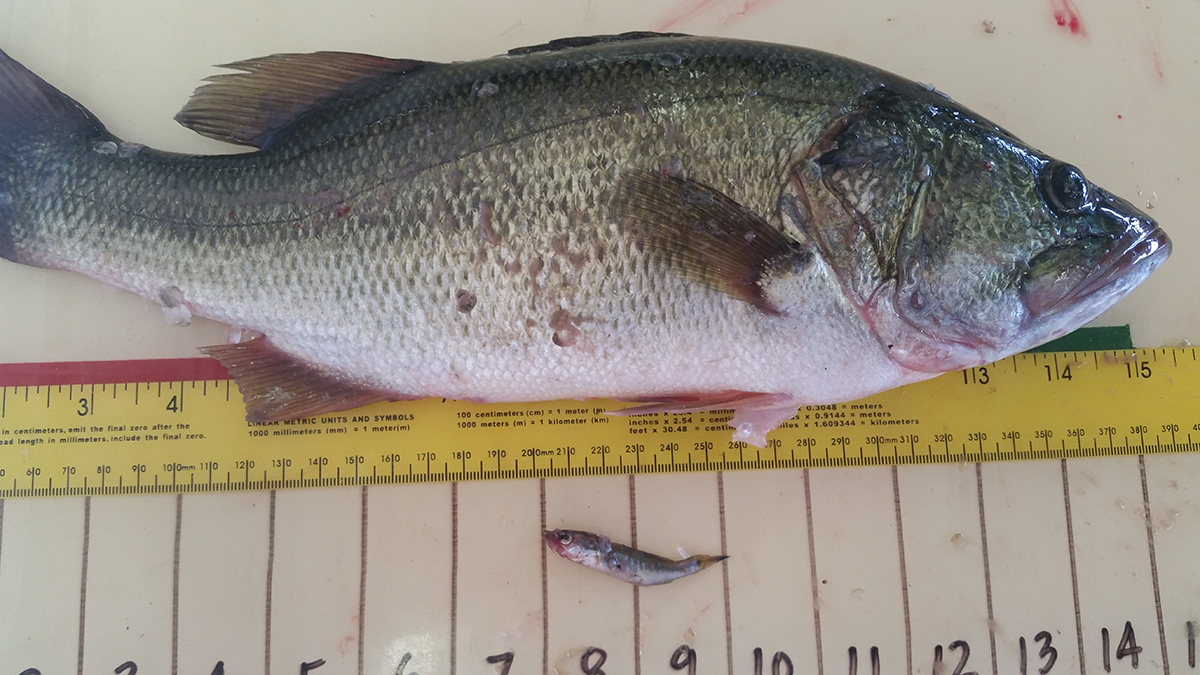
One of the most important aspects of reservoir ecosystems influenced by the chemical and biological composition of the system is the flow of energy from primary producers to top consumers. Knowledge of the components of the food web (sources; e.g., aquatic vegetation, phytoplankton) supporting species of interest (consumers; e.g., largemouth bass) is necessary in order to make predictions of potential shifts in community structure that may result from environmental changes and for the implementation of adaptive management strategies ensuring sustainability of desired biological communities. This project aims to collect water and a myriad of potential sources and terminal consumers for measurement of 13C and 15N isotopic signatures.
Stable isotopes are a widely used tool for tracing the flow of nutrients and energy through aquatic ecosystems (Middelburg 2014). Data derived in this study should elucidate the linkages (i.e., source-consumer) and complexity (e.g., trophic levels, number of resources utilized) of the food web, as well as the importance of internal relative to external energy and nutrient inputs to the reservoirs of Austin. Mixing models will be developed to give frequency distributions (i.e., relative contributions) of lower trophic level components in a consumer’s diet (Phillips and Gregg 2003; Phillips et al. 2005). This study will serve to not only describe in quantified detail the current food web structure of the reservoirs, heretofore unknown, but will also serve as a baseline for comparison as the structure of the reservoir’s change under as yet unknown pressures or public desires (e.g., increased vegetation in Lake Austin; increased flows reducing vegetation in Lady Bird Lake).
Visit the Hydrilla web page for more information.
Plants in aquatic systems are often overlooked as critical components of healthy ecosystems. Aquatic and riparian plants can provide valuable invertebrate, fish and wildlife food and cover, improve water clarity and quality, reduce shoreline erosion and sediment re-suspension, and help prevent spread of nuisance exotic plants. These qualities contribute significantly to ecosystem health and function, which in turn improves the value of the lake as a natural resource.
Inland water bodies in the U.S. include reservoirs, large and small lakes, permanently inundated wetlands, ponds, and riverine systems. Waterbodies exhibiting poor ecosystem health often exist in one of three conditions interrelated to aquatic plants: 1) they completely lack native aquatic plants, 2) they support native plant communities that are insufficient to provide system-wide benefits, or 3) they are infested with nuisance species that cause both environmental and water project use problems.
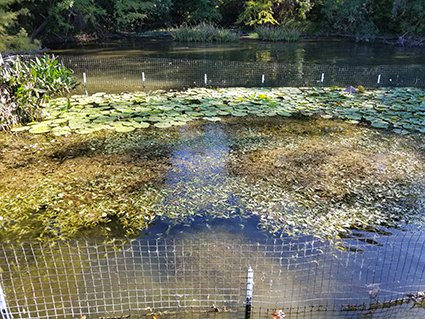
Because larger aquatic systems (generally greater than 100 acres) are logistically difficult to apply full-scale plantings, the US Army Corps of Engineers – Engineer Research and Development Center ERDC has developed an approach for accelerating the natural process of aquatic plant establishment and spread by utilizing founder colonies. Founder colonies are typically comprised of moderately small (usually less than one acre) plantings made at strategic locations within the waterbody. The principle function of a founder colony is to overcome one of the major impediments to aquatic vegetation establishment: availability of propagules for natural spread. Continual provision of propagules (seeds, fragments, etc.) from founder colonies ensures that they are present when conditions are suitable for natural spread to other areas of a lake. Once established, founder colonies spread in two manners, including vegetative growth from the founder colony itself (e.g., along stolons or rhizomes) and formation of new colonies from fragments, seeds, etc. In addition to supplying propagules, founder colonies provide immediate small-scale (up to 25 acres benefit from each acre of founder colony) habitat improvement in large and intermediate systems. In addition to protecting plants, the structure of enclosures themselves serve as refugia for aquatic organisms such as small fish in waterbodies prone to periodic disturbances (drought, floods, etc.) even when they do not support plants.
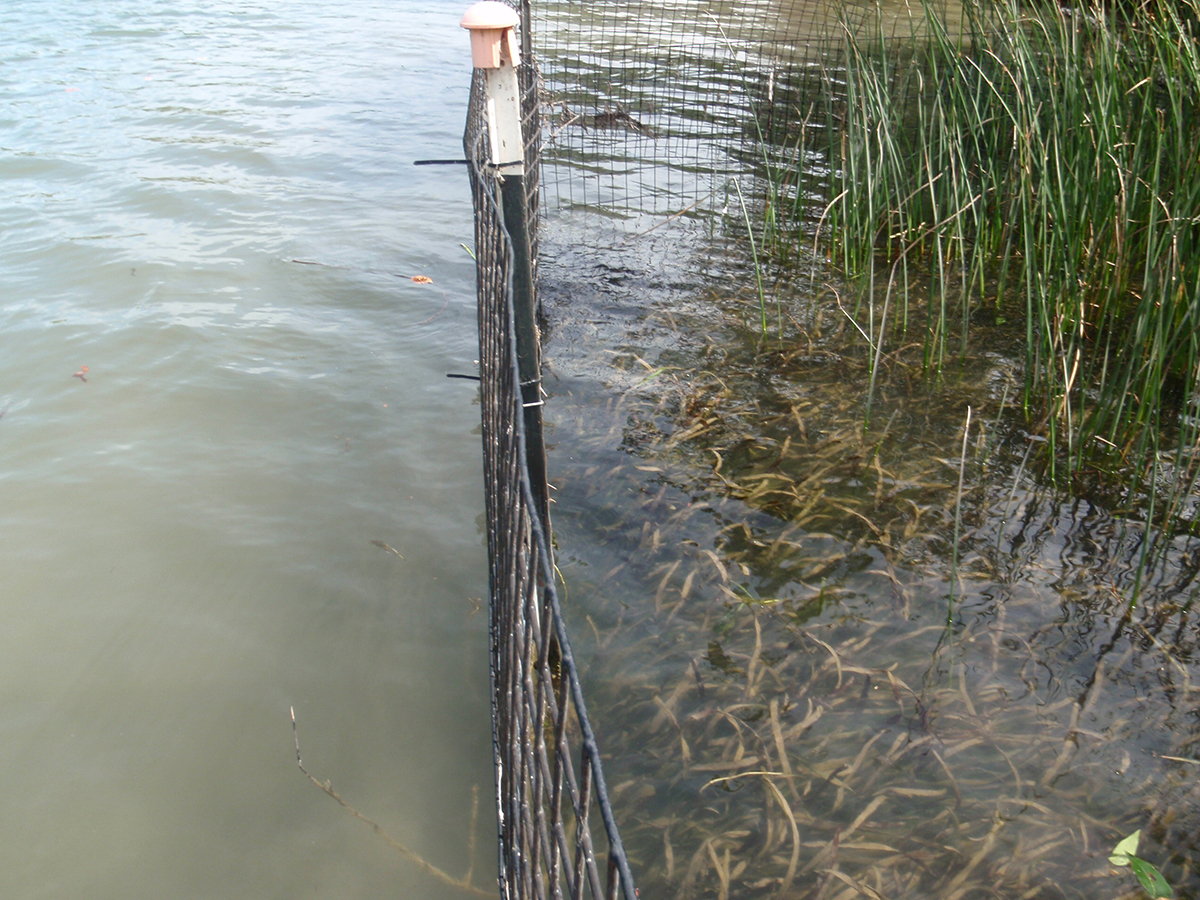

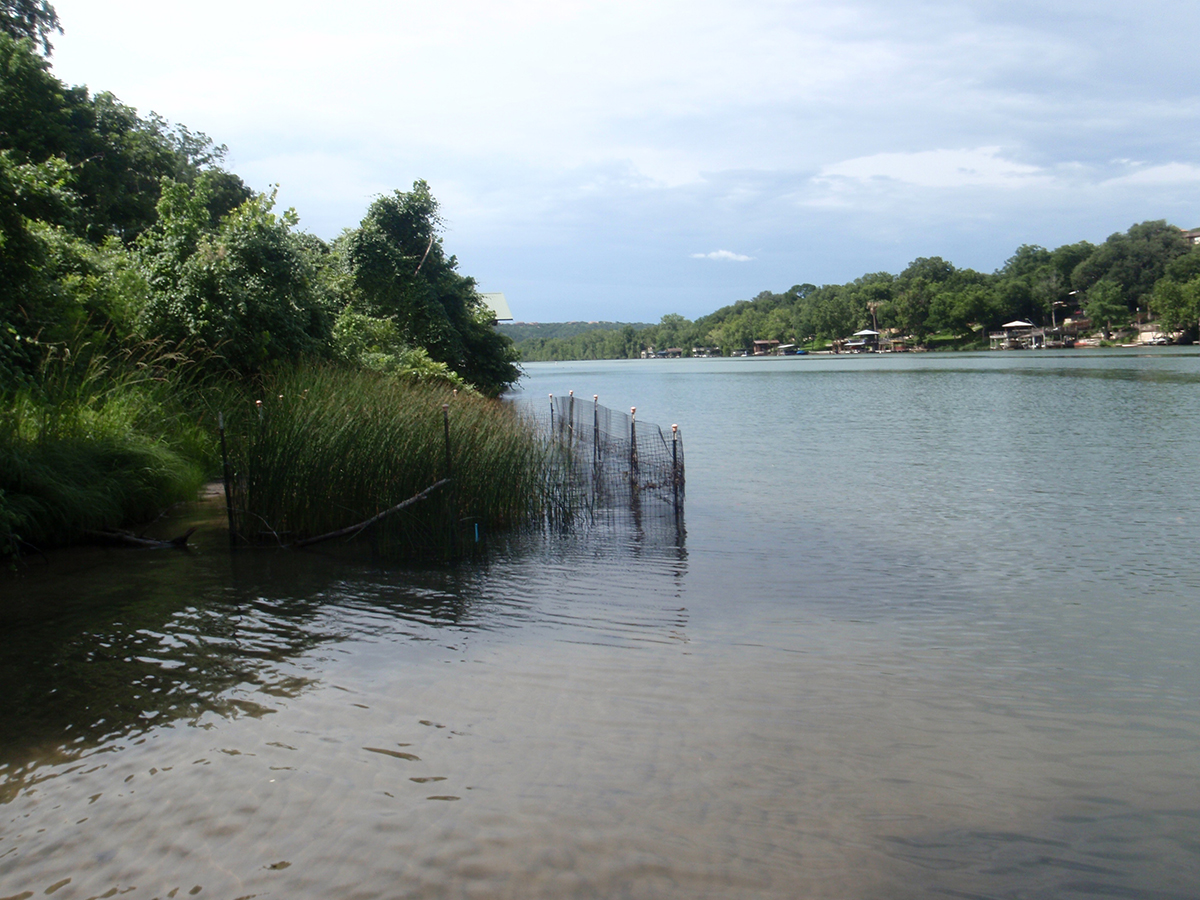
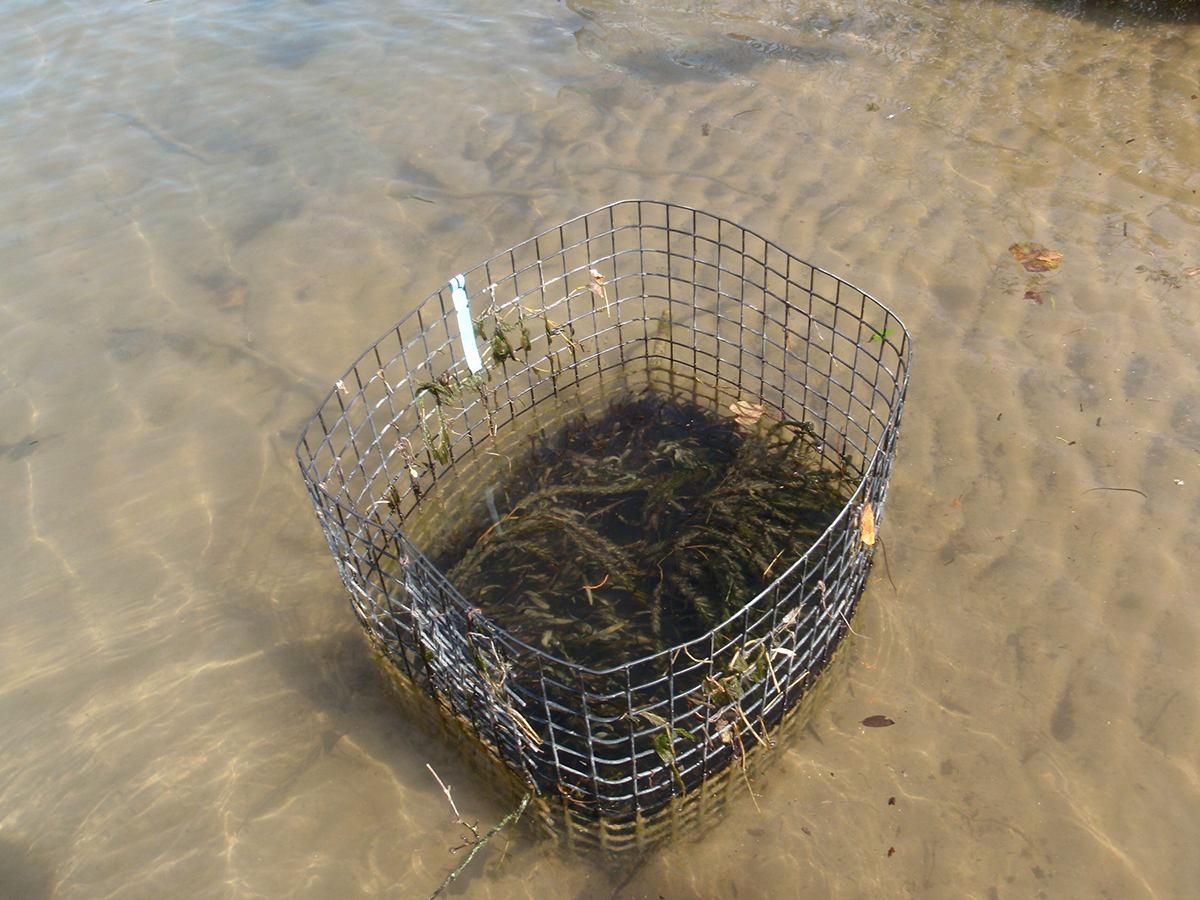
In 2016 and 2017, City staff expanded our herbivore exclusion pen installations, putting in large (20' x 50') pens, connecting neighboring pens, and extending pen boundaries to the shoreline. At two sites in Lake Austin we have effectively created vegetation plots each exceeding 4,500 sq ft in size.
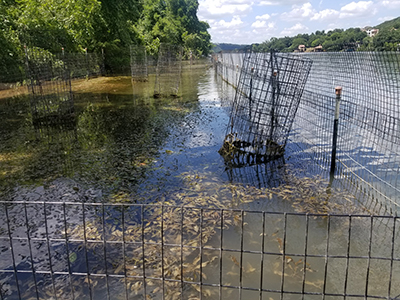
From the approx. 36 one gallon plants originally planted in each pen, we have seen over the past two years a completely expansion and filling-in of the pens with desired, native vegetation. In 2017 we installed a new vegetation pen in Lady Bird Lake. With the return of large discharges through Lady Bird Lake, the native aquatic plant cabomba, which had been prolific in Lady Bird Lake the previous three years, was effectively washed out of the reservoir. In order to re-establish some aquatic vegetation, we installed a new 20' x 50' herbivore exclosure pen just downriver of MoPac. The pen was planted in July and by October was completely filled in with vegetation creating a complex canopy of leaves submersed, floating, and emergent of the water surface.
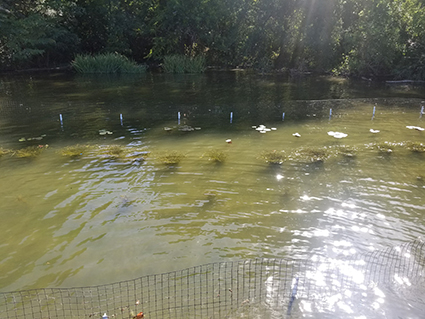
Pen was planted in July 2017.
Pen full of vegetation in October 2017.
Barton Springs Salamander
Barton Springs Pool – Parthenia Spring
Parthenia Spring, the fourth largest spring in Texas, is fed by the Edwards Aquifer and discharges as part of Barton Creek. Before western colonization of the area, the Native Americans used the springs as healing grounds. Until it burned down at the end of the 19th century, a flour mill utilized part of the spring-fed creek. In 1917, Barton Spring was designated a city park. At the time, only manmade rock dams were built to create a pool for swimming, and after every flood, the dam would have to be rebuilt. In 1929, a permanent lower concrete dam was constructed, and the upper concrete dam followed only three years later creating Barton Springs Pool. A concrete tunnel beneath the north sidewalk of the pool bypasses all creek water from upstream of the pool (except during flood events), discharging the creek water into Barton Creek downstream of the lower pool dam. Although Barton Springs Salamanders inhabit Barton Springs Pool, it is open to the public year round with little to no human disturbance to the salamanders or their habitat.
Individual salamanders are usually observed around the main spring outflows, hidden within a 1 to 6" deep zone of gravel and cobble overlying a coarse sandy or bare limestone substrate. These areas are noticeably clear of fine silt or decomposed organic debris and appear to be kept clean by the briskly flowing spring water. Salamanders are also occasionally found around minor spring outlets within the limestone fissures.
Federal Conservation Status On April 30, 1997 the U.S. Fish and Wildlife Service (USFWS) added the Barton Springs Salamander (Eurycea sosorum) to the list of endangered and threatened wildlife which receive federal protection under the Endangered Species Act. In proposing the listing of E. sosorum, the USFWS cited the following concerns:
"The primary threats to this species are degradation of the quality and quantity of water that feeds Barton Springs due to urban expansion over the Barton Springs watershed. Also of concern is disturbance to the salamander's surface habitat in the pools where it occurs. This action implements Federal protection provided by the Act for the Barton Springs salamander." (USFWS, 1997
The Barton Springs Salamander is carnivorous and likely eats any invertebrate small enough to fit into its mouth. Known prey items include ostracods, chironomids, copepods, snails, leeches, adult riffle beetles, mayfly larvae, amphipods, oligochaetes, and amphipods. The Austin Blind Salamander likely eats the blind amphipods found in the aquifer.
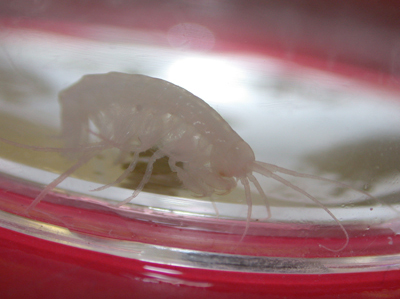
Photo by Dee Ann Chamberlain
Around 1903, Andrew J. Zilker and the Elks Club built a concrete amphitheater around Eliza Spring for keeping cool during meetings in the summer. The amphitheater allowed for the pre-existing spring run to follow its natural course. A few decades passed and the natural spring opening was covered with concrete to form a solid base for the amphitheater. From this point on, the only inflow from the aquifer into Eliza Spring is a series of small (6-8”) upwelling holes and a series of 15 vents around the base of the lowest bench of the amphitheater. Outflow has since been altered to follow a concrete tunnel underground and to discharge into the Bypass beneath the north sidewalk at Barton Springs Pool.
The only known surface habitats of the Barton Springs Salamander are the Barton Springs segment of the Edwards Aquifer and its contributing zone. They have been found in all four of the springs collectively known as Barton Springs: Parthenia Spring within Barton Springs Pool, Eliza Spring, Old Mill Spring (Sunken Garden), and Upper Barton Spring. They are most often observed in spring flow under gravel and small cobble a single to a few layers deep that is clear of fine sediment. Unobstructed interstitial space (the space between the rocks) is critical because it provides hiding space from predators and habitat for prey items (macroinvertebrates). When the interstitial space in filled with fine sediment or becomes compacted, the salamanders can no longer move within the safety of the substrate and the macroinvertebrates cannot colonize beneath the rocks. Salamanders are occasionally seen in bryophytes (aquatic moss) and macrophytes (aquatic plants) within the springs.
Population Monitoring
Surveys to monitor the population size of the Barton Springs Salamander are conducted on a monthly basis at each spring site. During these surveys, biologists carefully search the available habitat by removing stones and cover objects to a solid base (concrete, bedrock or compacted sediment) where the salamanders are typically hiding. Each salamander observed is categorized based on its size. Surveys are done in a systematic fashion to avoid counting any salamanders twice. Additional information is also recorded during these surveys, such as presence and abundance of benthic macroinvertebrates, and various measurements of water quality.
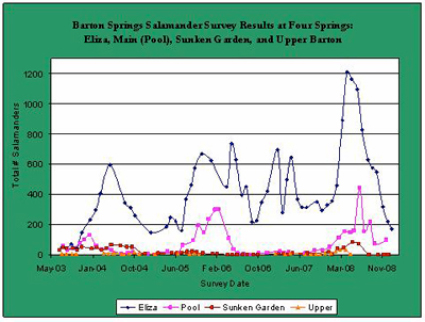
Survey Results
Below is a graph of the combined survey results for the Barton Springs Salamander over the past five years. As you may notice, there are large differences in the number of salamanders found at each site. Eliza Spring has, by far, the largest population of salamanders, followed by Parthenia Spring.
Another interesting trend is how widely salamander counts vary over time. This is important to biologists because their goal is to understand the factors that influence such fluctuations, as they have important consequences for the management and protection of this endangered species.
Eliza Spring
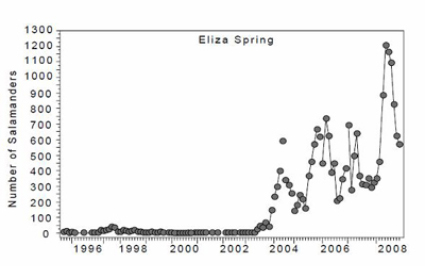
Eliza Spring has the most salamanders in part because large scale rehabilitation has occurred at this site. In late 2002, City biologists assessed the state of aquatic habitat in Eliza and its impact on the number of salamanders observed during a survey. At this point Eliza Spring had about 10 feet of water in it, had multiple layers of compacted rocks, trash and sediment as the substrate, and the outflow pipe was clogged with debris. Looking at the phylogenetic relationship of this species compared with other central Texas Eurycea, it was determined that the Barton Springs Salamander should be found in spring- or stream-like habitats, not pond-like habitat in Eliza.
This assessment brought on a reconstruction effort by City biologists to return Eliza Spring to more spring-fed stream-like conditions. Over the course of a year, trash and rocks were hand excavated by SCUBA diving in the spring and the outflow pipe was dislodged of all debris and native aquatic plants were reintroduced. By the end of the rehabilitation process, Eliza Spring was about a 1 foot deep and had a single layer of gravel/cobble on the concrete surface. The salamanders responded to this improved habitat. The graph below shows that on average the observed number of salamanders during surveys increased from the end of 2003 to 2008.
The response of the salamanders to rehabilitation at Eliza Spring has triggered efforts to improve the habitat at Old Mill Spring (Sunken Garden). Like Eliza Spring, Old Mill Spring (Sunken Garden) has an accumulation of sediment, rocks, and garbage that need to be removed to improve flow in the spring and provide better habitat for the salamanders and their prey.
In the late 1800’s, Old Mill Spring, also known as Zenobia Spring, was developed as a grist mill, and as a gathering place. The National Youth Administration began a project building a Sunken Garden surrounding Old Mill Spring in 1938. Rock walls were built around the spring and stone terraced steps were constructed within the spring leading out of the spring pool.
The Barton Springs Salamander (Eurycea sosorum) was not formally described until 1993, despite being known from the springs for at least 50 years. It is a member of the family Plethodontidae, which is the largest family of salamanders. It is in the sub-family Spelerpinae (Chippindale, Bonett, Baldwin, and Wiens, 2004, Evolution, 58: 2809-2822; Macey, 2005, Cladistics, 21: 194-202), which includes four genera: Eurycea Rafinesque, 1822 (27 sp.) Gyrinophilus Cope, 1869 (4 sp.) Pseudotriton Tschudi, 1838 (3 sp.) Stereochilus Cope, 1869 (1 sp.). Eurycea sosorum is most closely related to other species that inhabit the Hill Country in central Texas, south of the Colorado River. All are members of the sub-genus Blepsimolge .
The Barton Springs Salamander, like the Jollyville Plateau Salamander, was previously recognized at a population of the then-considered widespread Texas Salamander (E. neotenes). However it differs by a set of unique molecular (DNA and allozyme markers) as well as morphological characteristics, in comparison to other Eurycea. You can view the closest relatives of the Barton Springs Salamander in this phylogenetic tree.
Upper Barton Spring is located upstream of Barton Springs Pool and is the only Barton Springs Salamander locality that is unaltered. It is an ephemeral spring that stops flowing when Barton Springs discharge is about 40 cubic feet/second. The salamanders retreat with the water level and are thought to live within the aquifer until the spring begins to flow again.
Coal Tar
The City of Austin amended its Code to ban the use and sale of pavement sealants with more than .1% (1000 ppm) PAH by weight within the City’s planning jurisdiction (full purpose city limits and ETJ). The one exception is that the sealant may be sold if the intended application area is outside the City’s ETJ. The Austin ban was effective January 1, 2006 and was amended October 17, 2019 to expand the prohibition from coal tar to high Polycyclic Aromatic Hydrocarbons (PAH) sealants.
PAH’s are a group of chemicals formed during the incomplete burning of coal, gasoline, wood, garbage or other organic substances such as tobacco, charcoal broiled meat, and incense. As a pollutant, they are of concern because some compounds have been identified as cancer-causing. For example, one PAH compound, benzo[a]pyrene, is notable for being one of the first chemical carcinogens discovered; one of many found in cigarette smoke. PAHs are lipophilic (mix more easily with oil than water). The larger compounds are less water-soluble and less volatile (less prone to evaporate). Therefore, PAHs in the environment are found primarily in soil, sediment and oil substances, as opposed to water or air. However, they can be found in particulate matter suspended in air.
High PAH sealants may contain coal tar, coal tar pitch volatiles, RT-12, refined tar, steam-cracked petroleum residues, heavy pyrolysis oil, steam-cracked asphalt, pyrolysis fuel oil, heavy fuel oil, ethylene tar, ethylene cracker residue, or a variation of those substances assigned the chemical abstracts service (CAS) numbers 65996-92-1, 65996-93-2, 65996-89-6, 8007-45-2, 64742-90-1, or 69013-21-4; and is for use on an asphalt or concrete surface, including a driveway, playground, or parking area.
Basis for the Ban
- PAHs are a high-profile pollutant of growing concern nationwide, due to increasing concentrations in waterways
- The ban provides an unprecedented opportunity to eliminate a significant pollutant threat to our local water resources
- The combination of chemical tracing, laboratory toxicity, and field-verified degradation provides ample evidence to support regulatory action to remove the use of high PAH sealants within the City’s jurisdiction.
During our annual surveys of stream sediment chemistry, concentrations of Total PAHs (the sum of 16 compounds) generally range from <1mg/kg to over 200 over the past 15 years (Fig. 1). A screening value of 23 mg/kg is used as a threshold, above which, aquatic life use is expected to be negatively effected (Probably Effects Concentration, or PEC), and most of our data falls below this value. However there are a number of locations that have exceeded this value one or more times, and we are looking at these sites carefully for temporal trends and potential best practices that will address the source of PAHs to these sites.
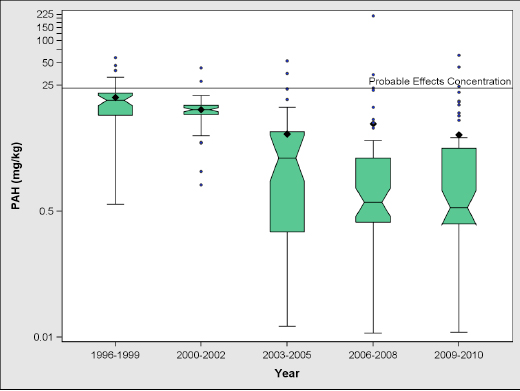
Figure 1: Box plot of total PAH (mg/Kg) collected in EII sampling from 1996-2010. Black diamonds represent means, notched lines represent medians, and small circles represent outliers.
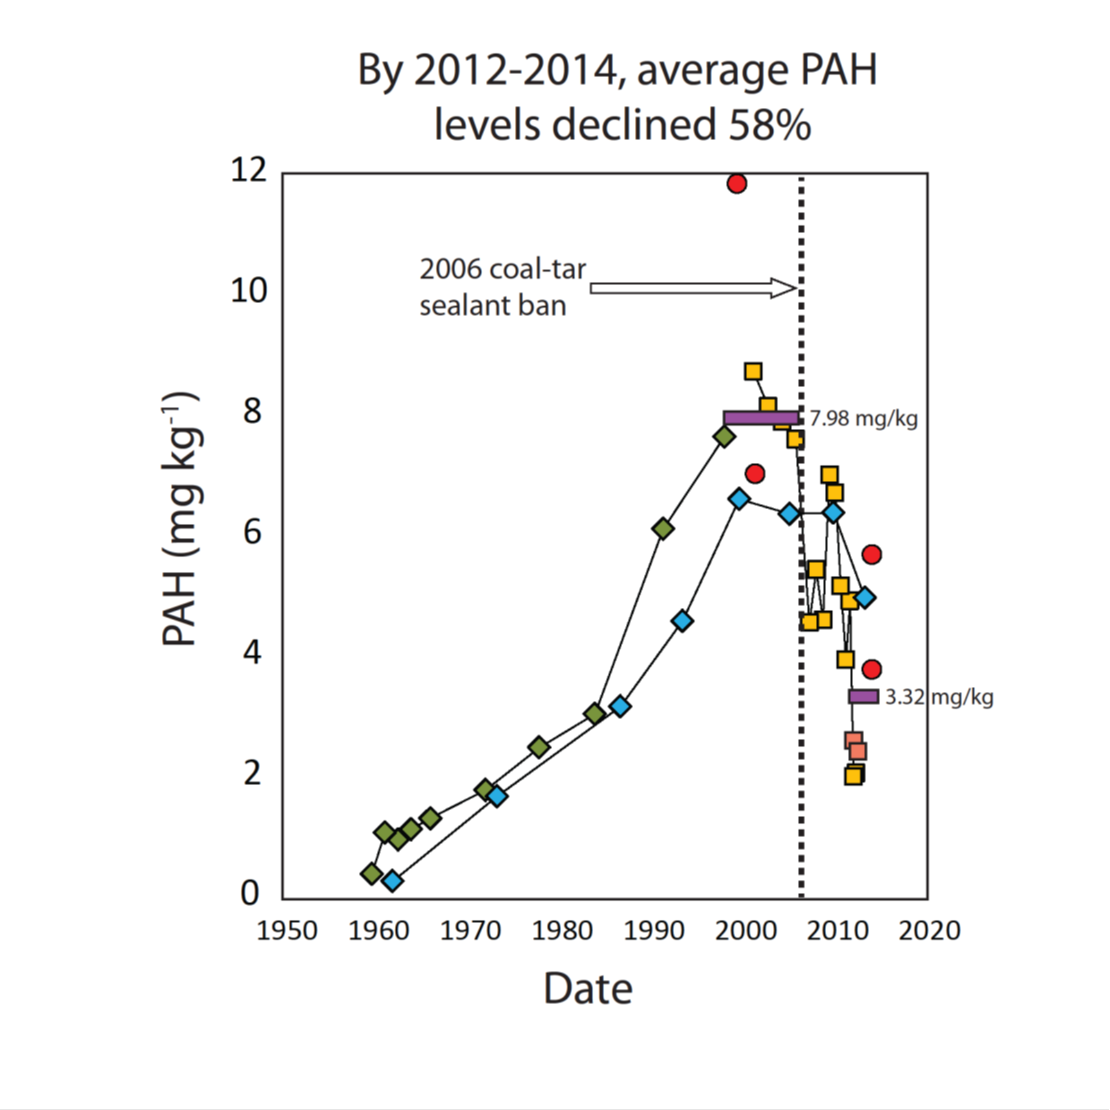
By removing this potent source of PAHs to our environment, we are reducing PAHs in our streams. A United States Geological Survey (USGS) study conducted in 2014 showed a 58% reduction in PAH’s in lake sediment from Lady Bird Lake.
Vehicle tires abrade parking lot sealcoat into small particles. These small particles are washed off parking lots by precipitation and into storm sewers and streams. Sealcoat “wear and tear” is visible in high traffic areas within a few months after application. Sealcoat manufacturers recommend reapplication every 2 to 3 years.
Besides urban runoff as a pathway, PAH can originate from atmospheric fallout of particulates from naturally occurring combustion sources like forest fires or from fossil fuel combustion - incomplete burning of carbon-containing materials like oil, wood, garbage, and coal. Automobile exhaust and industrial emissions are additional sources. They contain high levels of PAHs. More PAHs form when materials burn at low temperatures such as in wood fires and cigarettes than in high-temperature furnaces.
Many useful products such as mothballs, blacktop, and creosote wood preservatives contain PAHs. They are also found at low concentrations in some special purpose skin creams and anti-dandruff shampoos that contain coal tars.
Field staff for the Watershed Protection Department watch for sealant applications in progress and freshly sealed parking lots as they drive throughout the city on their other job duties. Newly applied sealants are screened for the presence of high PAHs. Enforcement action is taken when high PAH pavement sealant is found to be applied after the ban was initiated. Enforcement action through municipal court typically involves remediation of the applied sealant. The requirement for remediation is full removal of the applied sealant and fines.
The city produces and disseminates educational materials to producers, applicators, buyers, and to the general public through various means. City staff also periodically checks distributors to monitor product on their shelves.
Citizens may call in suspected high PAH applications to the City’s 24-Hour Pollution Hotline at 512-974-2550.
The detrimental effects of PAHs aquatic ecosystems are well documented. Examples:
- Fish - When fish are exposed to PAHs, they exhibit chronic problems, including fin erosion, liver abnormalities, cataracts, skin tumors, and immune system impairments leading to increased susceptibility to disease.
- Benthic macroinvertebrates - When benthic macroinvertebrates, insects and other organisms that live at the bottom of rivers and lakes and that make up the base of the aquatic food chain, are exposed to PAHs, they are susceptible to a number of detrimental effects, including inhibited reproduction, delayed emergence, sediment avoidance, and mortality. The most important mechanism by which acute effects occur in benthic invertebrates is a nonspecific narcosis-like mode of action that results in the degradation of cell membranes. Ultraviolet (UV) radiation greatly increases the toxicity of PAHs in a wide variety of aquatic organisms.
The City of Austin has conducted a range of laboratory and field experiments which documented the negative effect that PAHs from coal tar sealants have on benthic invertebrates that live in our streams. This work was a primary support and motivator for the ban of coal tar sealants in Austin
The City of Austin continually seeks ways to educate producers, applicators, buyers and the general public about high PAH sealants. City of Austin staff:
- Meet with applicators and producers
- Host public meetings with citizens
- Send regulatory and educational mail outs to producers, applicators, apartments, churches, public and private schools, rental car companies, large hardware stores, large food chains, large retailers, management companies, etc.
- Publish scientific papers
- Benchmark data and information with other cities
- Respond to requests for information from citizens and the media
- Create outreach pieces like: Ads in utility bill inserts, brochures, handouts, flyers
Sealants containing high levels of PAH should not be disposed of as regular garbage. Austin and Travis County residents may dispose of small quantities of these based products at the City of Austin’s Facility Recycle and Reuse Drop-Off Center. The facility is located at 2514 Business Center Drive and is open on Tuesdays and Wednesdays from noon to 7 p.m. Businesses requiring information regarding the disposal of coal tar based products may call 512-974-3443.
If you have specific questions concerning the regulations governing the disposal of high PAH wastes, please contact the Municipal Solid Waste Permits Section of the Texas Commission on Environmental Quality at (512) 239-2334.
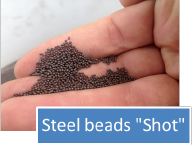
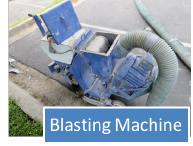
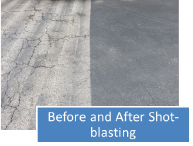
When a violation of the ordinance occurs, the City of Austin requires removal of the coal tar sealant. One of the most effective ways to meet this requirement is by a process called ‘shot-blasting’. Shot-blasting uses small steel beads or “shot”, and a blasting machine, to remove the top layer or layers of sealant. Blasting machines come in two different styles, walk behind (self-propelled or push) and ride-on, with varying blasting widths ranging from 8” to 48”.
The City of Austin requires that shot-blasting machines have a dust collection system (bag or cartridge filters) that minimizes or eliminates air-born dust particles containing harmful PAH’s from contaminating nearby soils, lakes or streams. The removed sealant should be properly contained on the site. Depending on the size of the removal project, some containment options may be bagging the waste in heavy-duty black trash bags or using a roll-off dumpster. Roll-off dumpsters should be properly covered with tarps or plastic sheeting to prevent runoff should precipitation occur. Once the project is completed the generated coal tar waste should be properly disposed of (See “Coal PAH Disposal” under the FAQ section)

Property and business owners should ensure that their contractor is properly licensed and bonded and will use the correct removal and disposal methods.
Listed below are contractors known to provide shot-blasting services for the removal of coal tar-based sealants. There may be other contractors that can perform the work. Contractors that are interested in being added to this list may email Christopher Miller to begin the process.
|
Name |
Contact |
Phone |
|
Paul Jackson |
405-495-9797 |
|
|
Chris Johnson |
972-881-0391 |
|
|
281-350-3663 |
This list is compiled from various listings and company contacts and may not represent all shot-blasting companies that service the Austin area. The Watershed Protection Department does not endorse company products or services and is not responsible for their performance.
Considering Seal Coating your Parking Lot?
The following recommendations will assist you in getting a better job that lasts longer while protecting the environment
Choose the Right Applicator
- Learn about the company and their track record. Ask the applicator for references and contact the Better Business Bureau or Chamber of Commerce to see if complaints have been lodged against the contractor. Take a few hours and visit some properties that the sealant company has done. Be sure and include a site that is more than a year old.
- Always ask the applicator what warranty is offered with the product and the workmanship. Often products are given a manufacturer’s warranty that may convey to the property owner when applied correctly. Get the warranty in writing before the start of work.
- Sealants come in a variety of packages and product names. Several producers require applicators be trained to apply their product, take a few minutes and inquire as to the applicators expertise.
- Get a written contract or agreement for the work.
Choose the Right Product
- Research the sealant to be used, how long it is likely to last and how it is made. Remember that sealants containing more than .1% PAH by weight are banned in Austin and its ETJ. Check the Safety Data Sheet (SDS) for information on the sealant ingredients. The company sealing your lot should have the SDS available. Click here for a list of approved products.
- If you have old PAH sealant present, consider having it removed prior to re-sealing. Equipment is available in Texas which can remove sealant with a shot blasting process. It can be done if dust is controlled and the removed sealant is disposed of in the trash. This eliminates the possibility of future coal tar pollution from old degrading sealant.
- Consider using a lighter colored sealant. Lighter colored sealant will often reduce the surface temperature of the parking lot. The payoff would be cooler cars for customers and staff parked all day, as well as a reduction in the heat island effect.
Ensure a Good Application
- Be certain that the sealant is applied at a proper dilution. Sealants are produced and designed to work best when the material is properly blended with water and fortifiers. Sealants are offered in concentrated forms as well as pre-diluted. Mixing must be done as recommended for the specific product to avoid premature failure of the application.
- Ask the applicator how long sealing a parking lot and re-striping will take. Some of the alternative sealants take longer to dry than the conventional coal tar based sealants. Often freshly applied asphalt based sealants are abraded quickly by traffic if not fully cured.
- Be certain to turn off the sprinklers, postpone trash/dumpster collection service and deliveries until the sealant has cured. Dried sealant and cured sealant look the same, but they are a world apart when a car drives over it.
- The contractor should not apply sealant when rain is in the forecast. The wash-off of freshly applied sealant is the most potent form of pollution discharge from a parking lot. Report any incidents of sealant wash-off to the 24-Hour Pollution Hotline at 512-974-2550
For additional information of the recommendations provided, please call 512-974-2550.
There are a variety of forces that wear sealant off of lots and driveways, but the abrasion of tires is probably the dominant one. In temperate northern climates, snow plows are probably another major factor. The City of Austin did a photographic coal tar sealant wear study, finding that drive areas wear at about 5% per year, and parking areas at about 1.5%, with an average of about 2.5% per year. A study in 2010 by the University of New Hampshire found that export of PAHs off of parking lots was much greater in the first three months (1357ug/L) than in the two years following application (17-116 ug/L), although elevated concentrations (52ug/L) of PAH from coal tar lots can persist for at least 5 years (Selbig, 2005).
Floodplain Management , Flood Safety , Local Flooding, Creek Flooding, Flood Early Warning System, Floodplain Regulations
It’s a good idea to determine the risk your property has of flooding. Is your house next to a creek or storm drain channel? Is it located at the low-point of a roadway or at the bottom of a hill? These are indications that flood insurance may be a good idea.
Mortgage companies usually require flood insurance for homes and businesses in the floodplain. Homeowners insurance policies do not cover flooding caused by stormwater.
Keep in mind that people outside of floodplain areas file more than 20% of flood insurance claims and receive about one-third of disaster assistance, when it is available.
For more information about who must purchase flood insurance, download FEMA’s Mandatory Purchase of Flood Insurance Guidelines booklet.
In regard to lowering your premium, you may already be getting a 20% discount because of the steps Austin takes to guard against flooding. In addition, there may be some improvements that you can make to protect your house or business from flooding. For more information, call our hotline at 512-974-2843 or send an email.
An elevation certificate may also be helpful. Prepared by a surveyor or engineer, elevation certificates show the elevation of your home in comparison with the expected elevation of floodwaters. If the certificate shows that the lowest floor elevation in your house is above the expected inundation levels, it should lower your insurance premium. The City may already have one on file for your house or business, but we cannot guarantee the accuracy. Please use FloodPro to look up whether we have a certificate on file or you may contact us by phone or email.
Download these FEMA publications to find out more about protecting your property:
- Protecting Manufactured Homes from Floods and Other Hazards
- Homeowner’s Guide to Retrofitting: Six Ways to Protect Your Home from Flooding
- Engineering Principles and Practices for Retrofitting Flood-Prone Residential Structures
- Above the Flood: Elevating your Floodprone House
- Protecting Building Utilities from Flood Damage
Creek Flooding, Local Flooding
A drainage easement is a part of your property where the City has limited rights of access and/or use. Generally, you cannot make any improvements in a drainage easement. That means no fences, sheds, walls, trails or buildings. You should avoid planting trees or much landscaping as well.
A drainage easement has two possible purposes. It may be needed for the flow of storm water. For example, drainage ditches and creeks are typically within a drainage easement. In this case, anything that prevents the flow of water; that might catch debris; that might be washed away; or that might cause a dam-like effect is problematic.
Alternatively, the easement may be needed to access drainage infrastructure. In this case, anything that might make it difficult to drive a truck through or dig up an underground pipe is problematic.
We look at a number of factors, including safety and cost. Some questions we ask are:
- What is flooding? Is it a house, a yard or a street that is flooding?
- Are there multiple properties in the same area that are flooding?
- Is there a safe way in and out of the neighborhood during a flood?
- Could improvements to the City’s infrastructure help with this problem? Would increasing the capacity of the storm drain system or raising the roadway help?
- Is there a cost-effective solution?
- Is the problem potentially life threatening?
- Is there a nearby erosion or water quality issue that could also be addressed with a project?
- Is the flooding likely to happen again?
Please email or call 512-974-9232 and ask about the possibility of releasing this easement. We will explore whether this is feasible. If it looks like there are no obvious problems, we will direct you to fill out an application for an easement release. The release process is handled by Real Estate Services, and there is an application fee whether the request is approved or denied.
Creek flooding occurs when the water rises in a creek and starts flowing out of the banks. Local flooding is not directly associated with a creek. It occurs before the water gets to a creek when runoff from heavy rainfall overwhelms the existing storm drainage system. The stormwater may flow through streets, yards and structures as the water seeks a path to a creek. This may happen because there are not enough ditches or storm drains or because there is something blocking the flow of water.
We look at a number of factors, including safety and cost. Some questions we ask are:
- What is flooding? Is it a house, a yard or a street that is flooding?
- Are there multiple properties in the same area that are flooding?
- Is there a safe way in and out of the neighborhood during a flood?
- Could improvements to the City’s infrastructure help with this problem? Would increasing the capacity of the storm drain system or raising the roadway help?
- Is there a cost-effective solution?
- Is the problem potentially life threatening?
- Is there a nearby erosion or water quality issue that could also be addressed with a project?
- Is the flooding likely to happen again?
Creek Flooding
We usually receive grant funding for buyouts, and the process depends on the type of grant. Usually, buyouts are voluntary. We will first get an independent appraisal. We will use this to make an offer based on fair market value. If the property owner accepts the offer, we will then help locate comparable housing. After closing, we will demolish the house that was bought and maintain the land as open space. There will be no future development on that piece of land.
Stormwater ponds with embankments or walls higher than 6 feet are monitored by the Stormwater Pond Safety Program. These ponds are inspected regularly to ensure they are functioning properly. However, if you notice any clogging, erosion, or other problems with any pond (regardless of size), please call 3-1-1.
Please call 3-1-1 and report the situation. A field crew will remove a downed tree or other large debris. As far as litter is concerned, we have a partnership with Keep Austin Beautiful for adopt a creek and volunteer cleanups.
The dam safety rules can be found in the Drainage Criteria Manual Section 8.3.4.B.
Click to download the City’s Integrated Pest Management Plan for Stormwater Ponds (4.7 MB PDF). (link: http://www.ci.austin.tx.us/watershed/downloads/spdsp_ipm_web.pdf)
creek
Flood Safety , Flood Early Warning System, Creek Flooding
Keep monitoring the situation and get ready to potentially evacuate or move to the second floor or roof. The flooding may get much worse very fast. In Austin, our creeks can rise several feet in just a few minutes. Keep in mind that the road providing access to your home may become impassible before water enters your house. Leave before the road is flooded. Do not attempt to drive or walk through a flooded road.
If there’s time, the following steps can help limit damage:
• Turn off all utilities at the main power switch and close the main gas valve if evacuation appears necessary. • Move valuables, such as important papers, jewelry, and clothing to upper floors or higher elevations. • Fill bathtubs, sinks, and plastic soda bottles with clean water. Sanitize the sinks and tubs first by using bleach and rinsing. • Bring outdoor possessions, such as lawn furniture, grills, and trash cans inside, or tie them down securely.
Local Flooding, Creek Flooding, Flood Safety
Call 3-1-1. The Watershed Protection Department will send someone to document the flooding. This helps us understand where projects are necessary.
Call your homeowners insurance company and follow their instructions to file a claim and repair your house. A separate flood insurance policy is required to cover damages due to flooding. Here are some precautions:
- Check for structural damage before entering your house. Don’t go in if the building might collapse.
- Do not use matches, cigarette lighters, or any other open flames, since gas may be trapped inside. Use a flashlight.
- Keep power off until an electrician has inspected your system for safety.
- Look out for snakes and other animals.
- Be careful walking around. Look for nails, broken glass or other hazards. Floors may be slippery due to mud.
- Document the damage with photographs.
- Clean right away. Throw out food and medicines that may have come in contact with flood water.
- Boil water vigorously for five minutes until local authorities proclaim your water supply is safe.
- Before you start repairs, contact the Development Assistance Center at 512-974- 6370 about possible permitting requirements.
Download this FEMA publication to find out more about repairing your home: Repairing Your Flooded Home.
Creekside Restoration
A degraded riparian zone is often entirely mowed, which results in bare soil along a stream bank. A lack of vegetation is a visible and primary variable that relates to overall riparian health. A degraded riparian area does not provide the important functions and services of a healthy riparian zone (see riparian function FAQ).
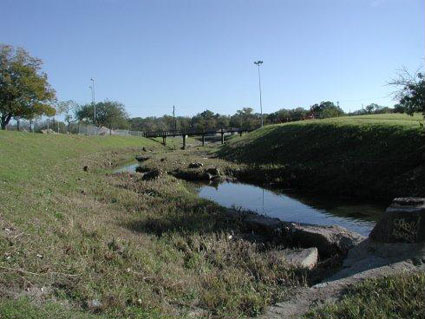
A heavily mowed, channelized creek exhibiting degraded riparian health.
Probably the most important driver of degradation to a riparian zone is the alteration of the natural hydrologic cycle that occurs from the urbanization of a watershed. This change or degradation in rain infiltration, flashy flows and baseflow essentially disconnects the banks and buffers from the stream and the water table. The types of vegetation that thrive in wet, active floodplains cannot survive in this disconnected state and the result is a degraded, abandoned, or upland vegetative community.

Changes that occur to riparian hydrology through urbanization (from Groffman et al. 2003. Down by the riverside: Urban riparian ecology. Frontiers in Ecology and Environment 6:315-321.)
After hydrology, the next most important factor that degrades riparian areas is alteration of the mature vegetative communities that evolve in these areas. This occurs primarily via human intervention, i.e. mowing, agriculture, logging or development. These activities remove the original vegetation, and degrade and compact the soil. These activities, when repeated over decades, make it very difficult to “replant” a healthy riparian vegetative community. Removing the disturbance that is keeping the riparian area in a degraded state is the most important thing to do in riparian restoration.
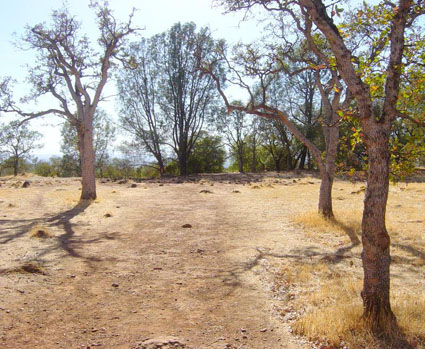
A trail area in a park where soil is compacted and vegetation is excluded.
The Department has considered how these Grow Zones affect flooding. Our engineers have determined if floodplains will increase with the anticipated fully grown out vegetation. The Grow Zone projects will not increase flooding on private property or public roadways.
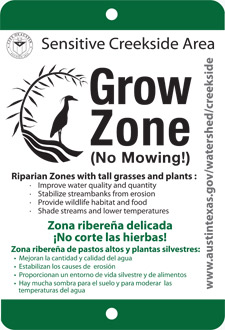 A “Grow Zone” is an effort to halt mowing along streams and allow the growth of more dense, diverse riparian vegetation. This improves water quality, lessens erosion, increases wildlife habitat, and provides other ecosystem services. It is our hope that Austinites will embrace these changes and appreciate the benefits of natural stream corridors. If you or your group is interested in getting involved please check out the options under the FAQ “What can I do?”
Participate
Click here to be notified about volunteer workdays along Grow Zones.
Several organizations in the local area, such as, Keep Austin Beautiful and the Austin Park Foundation coordinate volunteers to care for our natural areas. Pitch in to be part of the solution by adopting a creek or participating in It’s My Park Day!
A few local volunteer organizations that have been trained by WPD to self-lead some restoration techniques in Grow Zones follow this maintenance schedule.
If you would like to propose a volunteer project in a Grow Zone please use this form to make the request.
Help keep the riparian zone clean
Pick up trash and remove pet waste to enhance both the environment and our enjoyment of natural areas. Every time someone puts garbage in the appropriate waste receptacle, it is silently appreciated by those who never see the trash on the streets and in our creeks. www.LetsCanItAustin.org
Give positive feedback to Park officials
Positive feedback is always appreciated and helps provide encouragement for programs that seek to protect and restore natural areas.
Participate
Several organizations in the local area, such as, Keep Austin Beautiful and the Austin Park Foundation coordinate volunteers to care for our natural areas. Pitch in to be part of the solution by adopting a creek or participating in It’s My Park Day!
Restore the area you control
Evaluate the area that surrounds your home and help your personal environment become a functioning part of the greater environment. The City of Austin’s Grow Green program is a great place to start learning about plant selection to promote native Texas plants that provide benefits to wildlife such as butterflies and birds. You can even create a “Backyard Habitat” that can be certified by the Texas Parks and Wildlife Department.
If you live near a creek download our Creekside Homeowners Landscape Design Template.
Spread the word and shift the paradigm
In this increasingly urbanized area, our connection to nature is growing further and further apart. Communication will play a key role in turning our collective thoughts back to understanding the importance of nature. Tell a friend what you know and you’ve already doubled the effort.
Observe, learn and enjoy
Inspire the naturalist in you to learn the names, habits and functions of the plants and wildlife in our area. A fantastic way to appreciate nature is to take the time to observe it and learn about the extraordinary web of interactions that make natural riparian systems function.
Adopt-a-Creek groups who have an adopted creek section that’s a Grow Zone are encouraged to monitor the area. They select a 300-foot stream segment that best represents the area and conduct annual monitoring of the same sample plots over time. Monitoring takes place within the same month every year to capture long-term restoration progress. Click here to download the Citizen Riparian Monitoring Protocol.
Riparian zones can support plants that are unable to exist anywhere else. These plants in turn help to keep the riparian zone healthy and functioning properly. A plant guide for creekside residents can be found at Grow Green’s Creekside Homeowners Landscape Design Template , for a more general streamside restoration plant list check the Riparian Template. It is important to remember that healthy riparian vegetation can look shaggy and overgrown as it transitions into a mature woodland.
Download our Wetland Plants Field Guide (Web Friendly 7.8MB - High Resolution for printing 238.4MB) to learn more about plants seen in Central Texas creeks and wetlands.
Click here to see a video about how to plant bare root seedlings.
Ready, Set, Plant! is a partnership between the City of Austin Parks and Recreation Department’s Forestry Division, City of Austin Watershed Protection Department and local non-profit TreeFolks, Inc. to plant small native tree seedlings that will not require irrigation. Planting seedlings will enable us to restore native tree and shrub diversity during drought as well as retain water and improve water quality in Austin’s waterways.
Click here to download this restoration techinque's management guide for Removal of Invasive Trees- Weed Wrenching and Girdling.
Click here to download the volunteer restoration plan template. If you have any questions about developing a riparian restoration plan, please contact John Clement or Ana Gonzalez.
Click here to download this restoration technique's management guidefor volunteer leaders.
Ragweed is a native plant that maybe perceived as undesirable on stream banks. It has some benefits such as reducing the effects of direct sunlight on the soil and it likely reduces soil compaction while increasing soil moisture and organic matter. However, when ragweed growth is very dense it may slow down the establishment of other desirable species. In these cases ragweed stems can be bent at the beginning of their flowering stage in the fall. This technique gives other native plants a better chance of growing while maintaining the benefits that ragweed provides to the soil.
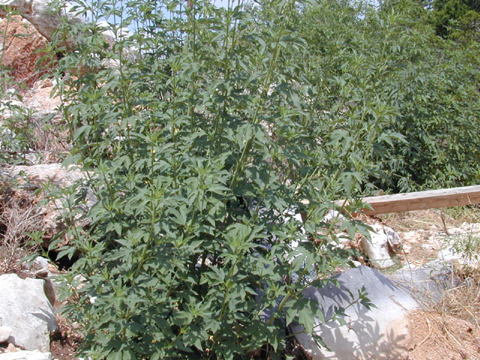
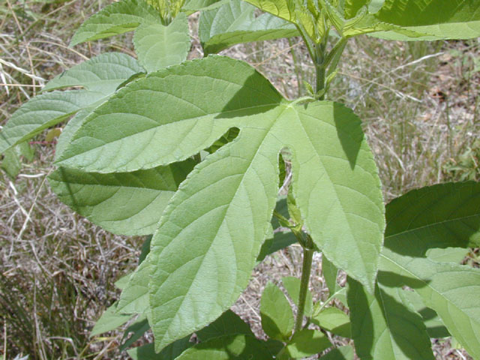
Maintenance Schedule (for local groups training by WPD in self-led restoration techniques)
Volunteer info
Profile, age range - appropriate for 10+ years old, with adult supervision
Clothes and safety - Closed toed shoes, long sleeved shirt, pants, individuals who are sensitive to allergens should also wear goggles and a mask
Click here to download this restoration technique’s management guide for volunteer leaders
 Click here to download this restoration technique's management guide for volunteer leaders.
Seed balls are marble sized mixtures of compost, clay, native seeds, and water. They are a cost effective, low maintenance method of re-vegetation which requires little water. Seed balls are scattered directly onto ground and not planted.
- Thoroughly mix dry clay (3 parts), compost (2 parts), and seed mix (1 part) specific for the light/moisture conditions of the site.
- Sprinkle with water until mixture sticks/binds together like cookie dough.
- Take a pinch of the finished mixture and roll (in the palm of your hand) into marble-sized round balls
- ‘throw’ or spread the seed balls within the Grow Zone or add them by coir logs
Maintenance Schedule (for local groups training by WPD in self-led restoration techniques)
Volunteer info
Profile, age range - appropriate for 5+ years old, with adult supervision
Clothes and safety - closed toed shoes.
Provided by Watershed Protection Department for official Grow Zones: Seed Mixes, clay, compost
Click here to download this restoration techinque's management guide for volunteer leaders .
This technique must only be done with WPD staff present or with a non-profit that has had direct training on the technique from WPD scientists. Click here to learn more about techniques used by WPD staff.
Maintenance Schedule (for local groups training by WPD in self-led restoration techniques)
Click here to download this restoration technique's management guide for volunteer leaders.
Plants help improve water quality and anchor soil. While soil is the foundation for plants, without roots to stabilize the soil, bare soil washes into our creeks whenever it rains. Seeds germination rates improve when there is good seed to soil contact.
- Rake the ground to loosen the soil.
- Spread seeds over the soil at the rate of 30lbs per acre.
- Press the seeds in to the ground.
Maintenance Schedule (for local groups training by WPD in self-led restoration techniques)
Volunteer info
Profile, age range - appropriate for 5+ years old, with adult supervision
Clothes and safety - Closed toed shoes, workgloves
Other tools needed - rakes
Provided by Watershed Protection Department for official Grow Zones: Seed mixes
It’s simple- the first step is to stop mowing along the stream edge, allowing vegetation to grow back naturally. While appropriate in some areas for public access and recreation, repeated mowing along the stream bank is not conducive to a healthy riparian zone and creek.
There will be a riparian buffer at least 25 ft wide on each side of the creek, with a variety of plant heights and thicknesses, and frequent open view corridors between 3’ and 7’.
Ecosystem function can be defined as all of the processes necessary to preserve and create goods or services valued by humans. Healthy functioning riparian zones:
- Improves the natural and beneficial functions of the floodplain
- Prevents stream bank erosion
- Filters storm runoff, removing pollutants before they reach the creek
- Provides habitat and food for a diverse group of animals
- Provides shade that cools air and water temperatures
- Creates a greenbelt forest with diverse tree and plant communities for outdoor enthusiasts
- Reduces the City’s carbon footprint
Riparian zone restoration attempts to restore the natural process necessary to maintain a high level of ecosystem function. In general, the larger the riparian buffer the more ecosystem functions it can provide.
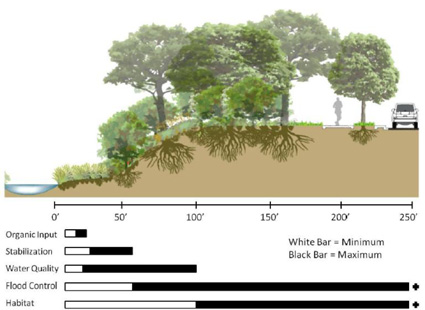
This image shows the various buffer widths associated with riparian zone function. Organic inputs into the stream are important sources of nutrients and habitat (width 15-25 ft). Stream stabilization is maintained by riparian vegetation (width 30-60 ft). Water quality is the ability of the vegetation to intercept runoff, retain sediments, remove pollutants, and promote groundwater recharge (width 20-100 ft). Flood control is the ability for the floodplain to intercept water and reduce peak flows (width 60- 500 ft). Riparian habitat is the ability of the buffer to support diverse vegetation and provide food and shelter for riparian and aquatic wildlife (width 100-1500 ft).
RIPARIAN ZONE RESTORATION METHODS
There are three generalized approaches to restoring a disturbed riparian environment:
(1) rely completely on passive (spontaneous succession)
(2) exclusively adopt active, technical measures
(3) or a combination of both passive and active techniques toward a target goal (Hobbs and Prach 2008). Passively restored sites exhibit robust biota better adapted to site conditions with increased natural value and wildlife habitat than do actively restored sites (Hobbs and Prach 2008).
Passive restoration requires minimal management and is more cost effective than alternative methods. However, passive restoration is often the slower approach and is more dependent on adjacent site conditions. When relying on spontaneous succession the vegetation community of adjacent sites, an approximate 100 meter distance from the disturbed site, is critical for successful restoration (Hobbs and Prach 2008). In general, passive restoration that relies on spontaneous succession should be employed when environmental disturbance is not very extreme (Figure 1) and no negative results (erosion, water contamination, negative aesthetic perception, etc…) are foreseen (Hobbs and Prach 2008). When site productivity and stress are extremely high or low, active (technical reclamation) may be necessary (Figure 1). The persistence of undesirable functional states is an indication that the system may be stuck and will require active intervention to move it to a more desirable state (Hobbs and Prach 2008). Understanding when passive versus active restoration approaches are warranted can increase chances of success and reduced project costs.
Passively restored sites exhibit robust biota better adapted to site conditions with increased natural value and wildlife habitat than do actively restored sites (Hobbs and Prach 2008). Passive restoration requires minimal management and is more cost effective than alternative methods. However, passive restoration is often the slower approach and is more dependent on adjacent site conditions. When relying on spontaneous succession the vegetation community of adjacent sites, an approximate 100 meter distance from the disturbed site, is critical for successful restoration (Hobbs and Prach 2008). In general, passive restoration that relies on spontaneous succession should be employed when environmental disturbance is not very extreme (Figure 1) and no negative results (erosion, water contamination, negative aesthetic perception, etc…) are foreseen (Hobbs and Prach 2008). When site productivity and stress are extremely high or low, active (technical reclamation) may be necessary (Figure 1). The persistence of undesirable functional states is an indication that the system may be stuck and will require active intervention to move it to a more desirable state (Hobbs and Prach 2008). Understanding when passive versus active restoration approaches are warranted can increase chances of success and reduced project costs.
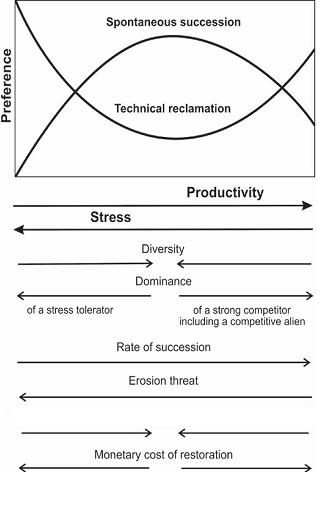
Establishing a buffer, with its mix of grasses, forbs/wildflowers, shrubs and trees, allows for a variety of benefits to the surrounding ecosystem:
- Filters pollutants out of storm runoff before it reaches the creek
- Limits erosion, protects creek banks and keeps sediment out of the creek
- Provides shade and maintains moderate water temperatures
- Provides habitat for a diverse group of animals, both on land and in the water
Trash in waterways is an unfortunate byproduct of society. Whether intentional or accidental, most trash that is dropped on the ground ends up in our streams and river. There are a variety of options for cleaning it up. The City of Austin assesses trash quantity using a visual assessment to evaluate severity. Streamside vegetation has the ability to capture trash floating in the streams, preventing it from going downstream to the Colorado River and Gulf of Mexico. The City of Austin does perform some trash clean-up but the problem is so extensive that it is impossible to keep all waterways free of trash. In order to better clean our streams it takes the whole community to take part. For this reason Keep Austin Beautiful assists Austinites with supplies and support for cleanups. If large trash such as furniture, appliances, and vehicles are in the stream please call 311 to report it.
What are the vegetative stages of riparian restoration?
Allowing a mowed stream and riparian zone to return to a natural state can take a while. Remember a forest can be cut down in a day but it takes a generation of care for it to return.

A variety of wildflowers are dominant during different seasons.

Grasses begin to grow taller, protecting the soil from the sun and forming a rich organic layer.
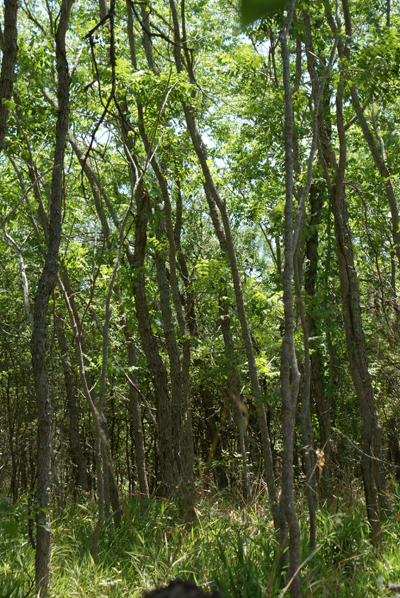
Tree saplings grow in abundance taking advantage of the full sun.

Years after the mowing ends the riparian zone reaches maturity.
There will be a riparian buffer at least 25 ft wide on each side of the creek, with a variety of plant heights and thicknesses, and frequent open view corridors between 3’ and 7’.
Society for Ecological Restoration
TPWD Managing Riparian Habitats for Wildlife
City of Austin Short Reports
SR-12-15- Live Staking in Riparian Restoration Projects
SR-12-13- Riparian Restoration Prioritization Methodology
SR-12-12- Riparian Functional Assessment
SR-12-11-Sapling Survival Assessment
SR-12-05 Functional approach to riparian restoration
SR-11-13 Riparian Reference Condition
SR-04-09-Development of Riparian Index
It’s happening all over Austin!!
The Watershed Protection Department and Parks and Recreation Department are working together to improve riparian areas in some City parks.
Click here for a map of the sites.
Click on the park name below to see a fact sheet describing the specific efforts at that park .
Big Stacy Park, Blunn Creek Greenbelt
Commons Ford Ranch Metropolitan Park
Shoal Creek Greenbelt at Allendale
Willowbrook Reach on Boggy Creek
Urban wildlife, or “backyard wildlife” is often limited in diversity, however by allowing an area to grow naturally, and reducing the urban characteristics this limitation can be reduced. Diversity of plants and increased layering, or structuring of plant types can provide the food and habitat for many of the animals that naturalists enjoy such as birds, butterflies, mammals, reptiles and a myriad of small critters.
Birds
Riparian corridors and adjacent woodlands can provide outstanding habitat for birds, both resident and migrating. Depending on the structure, diversity and health of the vegetation in the corridor, an amazing number of birds can be found here.
- Chickadees, mockingbirds, warblers, vireos, woodpeckers, titmice, sparrows, towhees, flycatchers, blue jays and wrens, depend on the wealth of insects that live on the grasses, forbs, wildflowers, shrubs and trees.
- Cardinals, dove, goldfinch, junco, and cedar waxwing gleam and important part of their diet from seed and berry producing shrubs.
- Hummingbirds drink nectar from some flower-bearing plants and small trees.
- Eastern screech owls, barred owls, and sharp-shinned hawks, and other predatory birds use wooded areas for their homes and hunting ground.
Butterflies
New leaves in the spring and early summer provide the critical food for the caterpillars that become moths and butterflies. Flowers from forbs, shrubs and trees provide nectar to many resident and migrating butterflies. Often caterpillars will only eat a certain type of plant (this is called host-specific relationship) so an increase in the diversity of plants will increase the diversity of butterflies.
- Skippers, satyrs, wood-nymphs eat grasses and sedges as caterpillars.
- Swallowtails eat some tree leaves especially citrus, black cherry and willow in addition to herbs such as relatives of dill, parsley and carrot.
- Monarchs and queens eat milkweeds and milkweed vines.
- Whites and sulphurs eat relatives of the mustard and legume
- Admirals, viceroy, sisters and morning cloak eat tree leaves, especially willows.
- Painted lady and red admirals prefer thistles and nettles.
- Great purple hairstreak eat mistletoe while other hairstreaks prefer legumes and mallows.
- Heliconians and fritillaries eat members of the passion-vine family.
Reptiles
Reptiles are a fascinating and beneficial part of riparian function. The vast majority of reptiles are harmless, and we only have four venomous species in Austin. Common harmless reptiles include:
- Gulf Coast toads thrive in riparian woodlands with loose soil, thick leave litter, shade and access to insects for food.
- Rough earth snake is a very small harmless snake that lives in the soil and leaf litter eating earth worms and slugs, and the non-venomous Texas rat snake helps control the rodent population.
- Red-eared slider and common snapping turtles must crawl out of the creek to lay eggs in the loose soil of the upper banks in the riparian corridor.
- Skinks are small lizards that live in leaf litter and eat insects
- Anoles are medium sized green/brown lizards that are sometimes mistaken for chameleons.
Mammals
The big winner of an improved riparian corridor is our ever-present fox-squirrel, however, the possibility remains for other native mammals to pass through if the corridor is wide enough and long enough.
- Fox-squirrels are frequent residents of parks and woodlands and primarily live in the trees.
- Grey squirrel (aka “rock squirrel”) are less often seen ground squirrels in steep hilly areas that burrow in the soil.
- Armadillos are crepuscular and nocturnal and may occasionally be found rooting around the loose soils and leaf litter in large riparian corridors.
- Grey fox are primarily nocturnal and usually stick to woodland areas that are undisturbed.
Small critters in the leaf litter
A myriad of small invertebrates live in the loose soil and leaf litter. They may be considered to be the most important animals since they often play a vital role in turning dead vegetation into soil and organic matter which plants need. These include crickets, earthworms, fly larvae, snails, slugs, beetles, etc. These small critters are also the primary food source for many of the insect-eating animals mentioned above.
Drainage Charge
There is a Stormwater Management Discount for both residential and commercial properties. The discount is for stormwater controls, such as rain gardens, rainwater harvesting or ponds, that exceed the legal requirements for development. Find out more about the discount program.
In addition, if you have an uncovered wooden deck and an unpaved portion of your driveways, we may be able to lower your impervious cover, which will in turn lower your bill. If you have these features, please call 512-494-9400 and ask about an administrative review of your drainage charge.
The following groups are exempt from the drainage charge:
- The state
- Counties
- Independent school districts
- Universities
- Religious organizations that participates in a specific program to provide housing for the homeless.
Additionally, properties without any impervious cover will not be billed a drainage charge, and the charge does not apply to properties outside the city limits.
Residential customers may request a reduced drainage charge based on financial need through the Customer Assistance Program. This discount on the drainage charge is only available to those being billed directly by the City for drainage. It is not available to residents of multifamily dwellings for which the property owner or owner’s agent pays the drainage charge.
If you rent a single-family home, duplex, triplex, fourplex or garage apartment, you will be charged for drainage on your electric bill. When there are multiple units, such as a duplex, we divide the charge evenly among the units.
If you rent an apartment in a complex with more than four units, we will charge the property owner or manager for the whole property. They may choose to allocate the charge to their tenants keeping in mind any applicable provisions in the lease agreement as well as the requirements in City Code Chapter 15-9 (Utility Service Regulations).
In general, the answer is yes. Stormwater runoff generated by impervious cover continues to occur whether or not the property is vacant. In addition, the City is striving to keep uncollected charges from vacant properties to a minimum to keep the rates as low as possible for everyone.
The process is different depending on whether the owner or the tenant(s) are paying for utility services. Tenants may be paying for utilities in single-family residences, duplexes, triplexes, fourplexes and some commercial properties.
If the owner of the property is paying for utilities, and shuts utilities off for vacancy reasons, the drainage charge will remain as a charge to that owner.
If tenants on a property are paying the drainage charge and call to shut down their utility account, then the charge will be transferred to the owner of the property, whenever possible. There may be situations where the property is vacant for only a short period of time and we are not able to bill the owner in the limited time.
City Code section 15-2-12 and City Code Chapter 15-9 Article 12 provide a process for requesting a review of your drainage charge and for adjusting your drainage charge, if warranted. The process includes an administrative review by the Director of the Watershed Protection Department and an administrative hearing by a hearings officer. There is more information about this process on the Drainage Charge Administrative Review web page.
Please call 512-494-9400 to initiate your request for administrative review.
The adjustment factor is based on the percent of impervious cover on an individual property. It adjusts the drainage charge upwards for properties with more than 52.3% impervious cover and downwards for those with less than 52.3% impervious cover.
It is calculated for each property using this formula:
Adjustment Factor = (1.5425 x percent impervious cover) + 0.1933
The formula for the adjustment factor is based on the “weighted” average percent of impervious cover for the entire city, currently estimated at 52.3%. A weighted average is a more accurate way to calculate an average when the items being averaged are of relative importance to each other.
The City of Austin will calculate your drainage based on the following formula:
Monthly Drainage Charge = Monthly Base Rate x Impervious Cover x Adjustment Factor
Monthly Base Rate
The monthly base rate is $0.00514 per square foot of impervious cover.
Impervious Cover
The impervious cover for each property includes surfaces like rooftops, driveways, parking lots, walkways, patios, unpaved driveways and unpaved parking. The City has measured the impervious cover for each property through its aerial data and mapping software, supplemented with zoning and development records.
Adjustment Factor
The adjustment factor is unique to each property and is based on the percent of impervious cover. It is calculated with the following formula:
Adjustment Factor = (1.5425 x Percent of Impervious Cover) + 0.1933
Drainage is “stormwater” that does not soak into the ground. It refers to water that falls as rain and runs off the land, and especially off of pavement or structures placed on the land. The City’s drainage system handles this water, and it consists of pipes, inlets, culverts, street gutters, ditches, channels, creeks, lakes, ponds, dams, tunnels and floodwalls.
Drainage can be a problem because of flooding, erosion and impacts on water quality. The drainage charge pays for programs that prevent, mitigate and/or correct these problems.
The drainage system should not be confused with the sanitary sewage system, which takes away water used in homes, businesses and industries for toilets, sinks, showers, washing machines and various types of business processes. The sanitary sewer system is a different system of pipes and infrastructure that lead to a wastewater treatment plant.
The stormwater drainage charge is shown on your monthly utility bill in the Drainage Service section. It funds the City of Austin's drainage utility mission and is authorized by the Texas Local Government Code.
The drainage charge was first adopted in 1982, the year after the 1981 Memorial Day Flood, which killed 13 people and caused $35.5 million in damage.
The drainage charge pays for a wide variety of programs to help with flooding, erosion and water pollution across Austin. Many projects and programs are working quietly behind the scenes to protect lives, property and the environment. Crews clean trash and debris from Lady Bird Lake, maintain our drainage infrastructure, and respond to more than 3,000 service requests annually. Staff respond to the pollution hotline about environmental spills and emergencies 24-hours a day. They coordinate numerous projects to help reduce the risk of flooding and erosion. Many of the programs, services and projects listed on the Watershed Protection Department web site are funded in whole or in part by the drainage charge and would not be possible without the charge.
Some projects that are funded entirely or in part by the drainage charge include:
- ATXfloods and closing of flooded low water crossings
- Restoration of the Shoal Creek Peninsula along Lady Bird Lake
- Boggy Creek Greenbelt Streambank Restoration
- Combating hydrilla on Lake Austin
- Buyouts of flood-prone properties
The rate structure for the drainage charge is based on the impact that buildings and other improvements on a property have on Austin’s drainage system. It is important to note that the charge is based on the impact to drainage by manmade structures, not naturally-occurring drainage. State Code only allows municipalities to charge properties that have a structure or other improvement on it. Undeveloped properties are exempt from a charge.
The City is using both the amount and the percent of impervious cover on each property to calculate the charge because using both these parameters provide a very accurate basis for determining the proportional impact of each property to the drainage system.
The City completed a Stormwater Runoff Study in 2008. During the more than two decades of this study, staff collected measurements for 36 monitoring stations citywide. The study indicated that higher percentages of impervious cover result in higher stormwater runoff volume. Stormwater runoff contributes to flooding, erosion, and water pollution.
The City also uses standard hydrologic methods to design drainage improvements like storm sewers or creek bank stabilizations. These standard methods drive our construction costs and also closely relate to the observations from the 2008 Stormwater Runoff Study. Both standard methods and local observation indicate a strong correlation between runoff volume caused by development through the amount and the percentage of impervious cover.
Using both the percent and amount of impervious cover to calculate the charge provides a way to more closely relate the drainage charge to the individual impact of each property’s development to the operations and maintenance of the City’s drainage system.
The impervious cover data is generated using aerial photography collected every two years. Each pixel on the aerial photography represents 6 inches on the ground. The accuracy is suitable for defining the edges of buildings, patios, driveways and other types of impervious cover. This data was used to create impervious cover maps seen on the Find My Drainage Charge Map Tool. (For best results, use Internet Explorer 9 or higher, Firefox, Google Chrome or Safari.)
For properties developed or modified after the latest aerial photography, we use building permit data. Bills are typically adjusted based on the latest aerial photography in February during odd-numbered years.
If you make changes to impervious cover on your property, expect your drainage charge to change. However, there may be a lag time before changes are reflected in your charge. Changes that may affect your charge include increasing your parking, building an addition or adding a deck or shed. Removing impervious cover will reduce your charge. If you have removed impervious cover, please call 512-494-9400 to let us know, so we can adjust your charge for you sooner.
If you want an estimate of how changes to your property will affect your drainage charge, use the Drainage Charge Estimator.
The following information pertains specifically to the calculation and application of impervious cover for determining the drainage charge imposed by the City of Austin's Watershed Protection Department.
Impervious cover is any type of human-made surface that doesn’t absorb rainfall, including:
- Rooftops
- Patios
- Driveways, paved and unpaved
- Sidewalks
- Roadways
- Parking lots, paved and unpaved
- Some decks
Uncovered wooden decks and unpaved portions of driveways count as 50% impervious cover. If you have these features, we may be able to lower the impervious cover on your account, which will in turn lower your bill. Please call 512-494-9400 and ask about an administrative review of your drainage charge.
A more complete definition of impervious cover is found in Section 25-8-63 of the Austin City Code. While impervious cover has broader implications in terms of urban planning and land development regulations, this information focuses on its connection to the drainage charge. For more comprehensive information about impervious cover regulations beyond the drainage charge, please refer to the appropriate resources and guidelines provided by the City's Development Services Department.
Information may not be available because the account holder has requested confidentiality. Under the Texas Utilities Code, customers have a right to confidentiality in government-operated utilities. A customer can request that their address, phone number, billing information and information related to their volume of utility usage be kept confidential. For more information, please visit the Austin Energy web page explaining Confidentiality and Customer Rights.
Alternatively, impervious cover may not be shown if the property was recently developed after the latest aerial photography was taken. The aerial photography was used to create the maps shown on the "Find My Drainage Charge" tool.
Earth Camp
No, only Title I schools in the Austin Independent School District are eligible.
AISD 5th grade teachers that have been trained and attended a week of Earth Camp led by City staff may participate in Teacher-Led Earth Camp! To schedule contact Susan Wall
The four Earth Camp Field Guides are available below for you to download. They require Adobe Acrobat Reader for viewing. If you are scheduled for Teacher-Led Earth Camp, an Assistant will bring the field trip materials. If you would like to purchase materials, reference the "Materials" PDF file.
Field Trip Guide Contents * required when leading Teacher-Led Earth Camp
Edwards Aquifer/Barton Springs
- * Sinkhole Lesson
- *Karst Watering Holes Lesson (420 kb)
- Cave PowerPoint Lesson (42 kb)
- Cave PowerPoint Presentation
Barton Springs
- * Barton Springs Tour Lesson (210 kb)
- * Tour Map
- * Splash! Exhibit Lesson (111 kb)
Scavenger Hunt *only print the Lesson for the Park you will visit
All Parks Scavenger Hunt Lesson
- Blunn Creek Game Sheet - English (557 kb)
- Blunn Creek Game Sheet - Spanish (528 kb)
- Blunn Creek Trail Map (522 kb)
- Bull Creek Game Sheet - English (485 kb)
- Bull Creek Game Sheet - Spanish (479 kb)
- Bull Creek Trail Map (4 mb)
- Walnut Creek Game Sheet - English (671 kb)
- Walnut Creek Game Sheet - Spanish (567 kb)
- Walnut Creek Trail Map (146 kb)
- Slaughter Creek Game Sheet - English (515 kb)
- Slaughter Creek Game Sheet - Spanish (510 kb)
- Slaughter Creek Trail Map (510 kb)
- Colorado River Game Sheet - English (649 kb)
- Colorado River Game Sheet - Spanish (561 kb)
- Colorado River Trail Map (3.2 mb)
- Creek Observation Data Sheet (146 kb)
- Flowers (3.8 mb)
- Ammonite (407 kb)
Green Classroom
- * Watershed Pollution Activity Lesson (173 kb)
- * Nine Square Puzzle Lesson (191 kb)
- * Soak In Run Off Lesson (181 kb)
- Green Gardening Lesson (194 kb)
Macroinvertebrate Activities
- Macroinvertebrate Test Lesson (997 kb)
- Bug Pollution Test-English (2.25 mb)
- Bug Pollution Test-Spanish (2.25 mb)
- Aquatic Bug Game (26kb)
Earth School
Email Jessica Gordon or call 512-974-3082 to receive a registration form.
The Earth School presentation is typically one hour and 3o minutes per class (however, special accommodations may be made for a longer or shorter presentation). The more time we have scheduled with your students, the more in-depth educational opportunities we can provide.
The Earth School presentation can accommodate up to 30 students per presentation.
It is helpful if tables can be arranged so that students can work in five separate groups. Access to running water is necessary. The presentation should be in an outdoor location with classes rotating through because the materials are too heavy to move between presentations. Earth School leaders may also incorporate a short “learning journey” on your campus. Classroom teachers and teaching assistants are required to remain with the class throughout the presentation.
Teacher Testimonials:
“I LOVE that the lessons are outside. It was nice to incorporate our school grounds and out watershed into the lessons.”
“Great presentations! The kids learned A LOT and had a blast doing it.”
“This is a very valuable lesson for the students. I love the hands-on activities. Students are engaged and work together to discover the knowledge. It ties in well with concepts taught in class. The presenter was wonderful. The students truly enjoyed the lesson.”
“Not only was the information relevant to the curriculum, but it was relevant to the lives of the scholars.”
“I loved all of the interactive activities. The kids were 100% engaged.”
If your school is not able to schedule all of the presentations in one day, you can schedule two consecutive days.
An Earth School teacher will bring all of the materials that students need. If you regularly incorporate an interactive science notebook into your classroom routine, you may wish to have students arrive to the presentation with their journals.
Registration forms are accepted throughout the school year, but the earlier you register the more likely you are to receive your choice dates.
East Austin Environmental Initiative
The goals of the East Austin Environmental Initiative are:
- Work with the community to better identify environmental issues and problems, increase awareness and to develop community interest in pollution prevention and clean up.
- Enhance the City's environmental activities in East Austin and coordinate local, state and federal environmental efforts in the region.
- Increase the public's awareness of the Watershed Protection's water quality protection programs and the City’s water and energy conservation programs and services
- Reduce point and non-point source pollution in East Austin.
- Investigate reported environmental problems and seek solutions to those problems.
- Increase the number of inspections of permitted and non-permitted facilities and the number of Stormwater Discharge permits issued in the East Austin area.
The East Austin Environmental Initiative (EAEI) was created in the Fall of 1993 to address environmental issues in the area of Austin east of IH-35. The increase in environmental activism and awareness in the eastern region of the City, as well as the desire to maintain equity throughout the City has highlighted the need for this effort. The Initiative was originally established as a cooperative effort of 4 Watershed Protection Department (WPD) programs; the Spills & Complaints Response Program (SCRP), the Stormwater Discharge Permit Program (SDPP), the Stormwater Monitoring Program (SWMP), and the Austin Brownfields Initiative. The Initiative originally had a budget of approximately $340,000. In July of 2007 the SWMP retracted from the program citing fiscal restraints. Currently, there are 6 EAEI team members: 2 from the SCRP, 2 from the SDPP, 1 from the Brownfields Initiative, and 1 from Water Quality Education.
Initially, the EAEI focused activities in central East Austin, in the area north of Lady Bird Lake, east of IH-35, south of US 290 and west of US 183. In FY 97-98, the focus area was expanded to include areas south of the river and further north as well. This allowed coverage of most of what is traditionally considered “East Austin”. In FY 10-11, it was further expanded and today the Initiative focus area is bounded by IH-35 on the west, Ben White Blvd. on the south, Hwy. 183/Walnut Creek on the east, Hwy. 183 on the north and also along Hwy 71 East in Del Valle up to FM 973 South.
Click here to see a map of the East Austin Environmental Initiative Area
-
Community Outreach and Interagency
Staff from all EAEI programs work together on educational efforts targeted at the East Austin community. Staff develops and distributes written materials, including the biannual newsletter, Eastside Environmental News, as well as special educational pieces as needed, such as doorhangers and mailed surveys. Team members also attend and often speak at community events and meetings to provide information on environmental topics.The EAEI team stays in contact with other local and state agencies to provide close coordination and cooperation on multi-jurisdictional environmental issues and to present the community’s environmental concerns.
-
Spills & Complaints Response Program (SCRP)
SCRP staff responds to, and investigate, hazardous and non-hazardous material spills and citizen pollution complaints to prevent and mitigate polluting discharges to the environment. Staff is available for emergency response 24 hours a day, 7 days a week through the City’s Environmental Hotline, 512-974-2550. A rapid response to environmental emergencies is provided to reduce potential environmental impact. SCRP staff assess the environmental impact, determine the responsible party, identify the pollutants, and ensures that corrective actions and preventive measures are taken. SCRP staff request and review sample results and remediation plans as needed, advise on applicable regulations and provide educational materials. Enforcement action is taken when necessary.SCRP staff develops special programs and provides training to local businesses and to the community to address pollution prevention.
The Shade Tree Mechanic program was developed after staff noticed that about 20% of Hotline calls were related to pollution problems caused by do-it-yourself automotive repair. This program offers participants a one-on-one assessment of auto repair practices and a free oil change bucket.
-
Stormwater Discharge Permit Program (SDPP)
The Storm Sewer Discharge Permits Program involves inspection and permitting of specific commercial and industrial businesses within the Austin City limits to prevent or mitigate polluting discharges to the City storm sewers and waterways. Site inspections are conducted to evaluate waste handling, storage, and disposal practices, maintenance activities, and operational condition of water quality controls. SDPP inspectors identify and ensure correction of illegal plumbing connections to the storm sewer system; identify and ensure cleanup of surface contamination; request and review sample results and remediation plans as needed; advise on applicable environmental regulations and pollution prevention measures; and, provide educational materials for business operators. Enforcement action is taken for non-compliance when necessary.The SDPP encourages businesses to adopt practices that reduce pollution by providing incentives through the Austin Clean Water Partners (ACWP) program. The ACWP program rewards businesses that demonstrate proactive pollution prevention and reduction practices. ACWP rewards include a framed Certificate of Participation, a poster and handbook that demonstrate appropriate businesses practices to comply with environmental regulations, T-shirts and window decals. Participants may also be recognized in local media outlets such as newspapers, television and radio stations.
The SDPP is also responsible for review of non-stormwater discharges to the City storm sewer system and waterways to prevent polluting discharges.
-
Austin Brownfields Redevelopment Office (ABRO)
The ABRO offers property owners/developers alternatives and incentives to address environmentally challenged real estate as economical and sustainable projects.With the combined resources from various organizations, the ABRO can help expedite the environmental assessment, remediation and ultimately redevelopment of Brownfields properties. ABRO applies for grants from the U.S. EPA to assist funding for environmental site assessments, low interest remediation loans and redevelopment planning with the community. Staff provides assistance in coordinating federal, state, and local funding resources and facilitates interagency cooperation for Brownfields redevelopment. Staff coordinates meetings with stakeholders, distributes Brownfields redevelopment publications and provides information to residents about Brownfields in their neighborhoods. ABRO has established partnerships with the U.S. Army Corps of Engineer, Regional Environmental Protection Agency, Texas Commission on the Environmental Quality, Capital Area Planning Council, Austin Area Urban League, Austin Revitalization Authority, several community neighborhood associations, non-profit and for profit organizations.
Environmental Integrity Index
Generally, there are six categories of data collected:
E.Coli Bacteria
- Contact Recreation - E. Coli Bacteria
- Human pathogen indicator
- 4 times per year/reach
- Non-Contact Recreation - Visual assessment form
- Aesthetic appeal to average person
- Garbage, odor, algae, clarity, etc
- Water Quality - Chemical measurements
- Nutrients (Nitrate-N, Ammonia-N, and Orthophosphorus
- Total Suspended Solids and Turbidity
- Dissolved Oxygen, Conductivity, pH and Temperature
- Sediment Quality - Sediment Chemistry
- Sampled at mouths of streams once per year
- Aggregates watershed inputs
- Metals, PAHs, pesticides and herbicides
- Habitat Quality - Forms based on visual assessment and direct measurements
- EPA national protocol, qualitative
- Non-scoring Pfankuch channel stability form
- Aquatic Life
- Benthic Macroinvertebrate Community (invertebrates)
- 9 metrics assessing: Diversity, Pollution Tolerance and Community Structure
- Evaluates stream health in terms of the preceding months to years
- Diatom Community (single cellular algae on rocks)
- Pollution Tolerance Index and Percent Similarity to Reference Conditions
- Evaluates stream health in terms of the preceding months to years
- Benthic Macroinvertebrate Community (invertebrates)
More detailed information on the specific methods for field and lab analysis in addition to metrics for determining scores is located in report COA-ERM-1999-01 Environmental Integrity Index Methodology, May 31, 2002 edition.
Click here to see the open data of Environmental Integrity Index results.
We have developed a watershed viewer, so it is easy to find out what watershed you live in and to find out its Environmental Integrity Index score.
The current two-phase monitoring cycle involves the monitoring of 122 sample sites within 49
watersheds in the City’s planning area.
Erosion Control and Stream Restoration
Analyses of sediment transport are performed to evaluate the ability of a channel to carry the incoming sediment load. The design goal for mobile bed channel projects is to achieve a state of dynamic equilibrium. This refers to a condition where the channel can transport the incoming sediment load without excessive erosion or deposition. The intent is that the channel retains its planform, shape and profile within an acceptable range of variability without trends. Most frequently for City of Austin applications the analysis is based on including a low flow channel within the active and flood conveyance channels. The Stream Restoration Program promotes the concept of sediment continuity to assist in assessing existing conditions and to design for a state of dynamic equilibrium. The levels of sediment continuity analysis and surrogates thereof may include:
Equilibrium (Steady State) Methods
- Incipient Motion (Threshold)
- Sediment Continuity
Dynamic Methods
- Sediment Continuity
- Sediment Routing
Sediment Continuity Concept
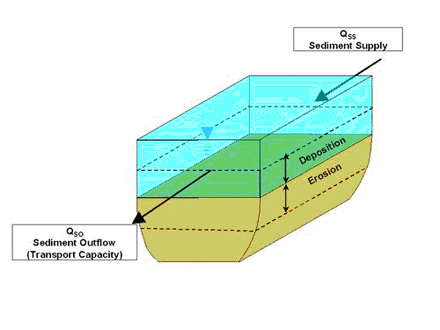
Steady-state and/or dynamic sediment transport models are used for analysis and design of stream stabilization projects. Commonly used models for sediment transport:
- HECRAS Stable Channel Design and Sediment Transport Modules
- SAMwin Hydraulic Design Package for Channels
- HEC-6
The initial step in a sediment transport analysis is evaluation of the mobility of the channel bed material. This is accomplished through comparison of the hydraulic shear stress (computed from hydraulic model) and the critical shear stress of the bed material. There are many paradigms for sediment and channel armor mobility. The Shield’s equation is most commonly used for this purpose:
where:
c = critical shear stress to initiate motion of bed material (lb/ft2)
SP = Sheilds Parameter (~0.05 for Austin gravel/cobble streams)
Sg = specific gravity of sediment (~2.4 - 2.65)
Ds = representative diameter of bed material from gradation (ft)
The ratio of hydraulic shear stress (o ) to critical shear stress (tc ) is know as the shear stress ratio. When the "shear stress ratio" (o / c ) exceeds unity or the "excess shear stress" (o -c) is greater than 0 the bed material becomes mobilized and moves downstream. Many sediment transport equations utilize the shear stress ratio concept to determine sediment transport rates.
In mobile bed systems the erodibility of the channel is dependent on the sediment supply from upstream sources and the ability of the design channel to transport the incoming load. Generally there are three cases related to the equilibrium condition of the stream.
Dynamic Equilibrium - the channel can transport the incoming sediment load without excessive erosion or deposition.
Transport Limited – The channel cannot sufficiently pass the incoming sediment load and aggradation results.
Supply Limited – The channel transport capacity exceeds the incoming sediment load and erosion/degradation occurs.
A stream channel is formed by the continuum of flows that the channel receives over time. The channel forming discharge is often selected as a surrogate to this range of flows.
Channel forming Discharge, also known as:
- Dominant Discharge
- Formative Discharge
- Effective Discharge
- Where the Channel is Going
The channel forming discharge is defined as a flow that transports the most sediment over time and determines the principal dimensions and characteristics of a natural channel. The effective discharge has been associated with bankfull discharge in the eastern U.S. However bankfull discharge is less applicable in incising systems and in arid/semi-arid environments. Therefore a collaborative approach including analytical methods, flood frequency and field investigation is used to identify channel forming discharge in the Austin area.
used to identify channel forming discharge in the Austin area.
Analyses of sediment continuity in the channel forming discharge range can be used to develop a family of stable channel dimensions that can provide for a condition of sediment continuity or dynamic equilibrium.
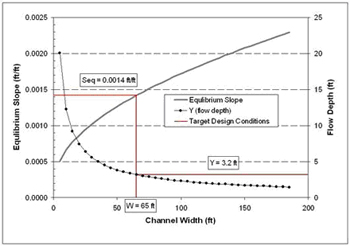
Utilizing sediment continuity requires definition of the upstream sediment supply, which can be expressed with a sediment transport-rating curve for the supply reach. Significant judgment and a thorough knowledge of the system are essential to estimate an appropriate supply loading for a rehabilitation design. A simplified approach in lieu of sediment continuity is the threshold approach setting the design hydraulic bed shear stress (o )to the critical shear stress (c ) at the channel forming discharge. This however may under estimate the sediment supply.
There are multiple combinations of slope, depth and width that could satisfy sediment continuity for a particular reach. More often than not there are space constraints that limit the range of solutions. In other cases one of the channel geometry variables (width, depth, slope) may be selected based on environmental and habitat criteria. Target velocities and/or depth suitable for fishes and bethnic communities may be used to define a template for the channel geometry. Following a stable slope is selected based on the sediment transport analysis.
Sediment transport analysis in combination with observations, experience, hydraulic geometry and planform relations can assist in predicting future channel response and provide design parameters for channel stabilization.
The Stream Restoration Program utilizes hydrologic and hydraulic models for estimating runoff quantities, rates and the hydraulic forces impacting a reach of stream. These analyses provide parameters for use in stable channel design. For projects within an existing floodplain, generally the existing FEMA hydrology and hydraulic models are used. For smaller projects models are developed for each specific project. Common models used are:
Hydrology: HEC-1 TR20 FFA
Hydraulics: HEC-2 HECRAS (HECGEORAS) WSPRO Manning’s Equation
Results from the H&H analyses are used to estimate channel boundary shear stresses and sediment transport capacities, which allow for prediction of future short- and long-term channel erosion and provides data for design of channel stabilization measures.
The first step in consideration of a stream stabilization project includes a site investigation or field reconnaissance where an assessment of stream conditions and the problem severity are made. Watershed Protection Department Staff: deduce the physical processes dominating the system, evaluate morphological state of the stream (channel evolution), identify constraints, consider potential solution types and extents, assess appropriate level of engineering analysis, and prioritize with respect to Citywide problem areas.
Fluvial geomorphology is the science dealing with the physical processes and characteristics of rivers and streams:
Some geomorphic factors considered during stream assessment are:
- Lateral and Vertical Channel Variability
- Bed and Bank Material Type, Composition and Stratigraphy
- Bed Forms
- Channel Cross Section Shape
- Channel Gradient
- River Valley Conditions
- Floodplain Conditions
- Riparian Vegetation
- Upstream Watershed Conditions (impervious cover, soils, vegetation)
Geomorphic analysis in the engineering and implementation context is used to quantify channel morphological parameters as they relate to design of a stable system. Geomorphic analysis provides:
- Quantitative channel and stability assessment tools
- Foundation for natural channel design
- Prediction of short- and long term channel change
- Optimize design for stability and natural channel processes
- Estimate maintenance requirements
All of these components interact with each other to form the ultimate channel configuration. In urban channels these elements often become “out-of-phase” with each other as the channel adjusts to imposed watershed conditions.
General Channel Stability There are levels of analyzing channel stability and developing solution types. Generally the approach is based on the extents of the affected processes and constraints typically limit the selected solution type. Channel stability can be looked at on a large watershed scale or down to site specific problems.
Approaches to Channel Stability
- Watershed-scale
- Upland Stormwater Management Controls
- (ponds, disconnected impervious cover, impervious cover limits)
- Reach-based
- Channel lengths with common hydraulic/morphologic characteristics
- Site Specific
- Stabilization of isolated stretch of channel (usually for property protection)
General Channel Adjustment For watershed, stream reach based and site-specific situations, the Stream Restoration Program utilizes the concept that a stream reach equilibrium is dominated by the hydrology, hydraulics and sediment load. A relationship proposed by Lane can be used to qualitatively identify these physical processes dominating the system.

Qw = water discharge S = channel slope Qs = sediment discharge Ds = sediment size
Our experience shows that the most common response to urbanization in degrading reaches can be represented as:
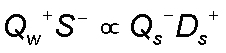
The (+) signs indicate an increase in water discharge (Qw) and coarsening of the channel bed material (Ds); the S- indicates the river slope would decrease through meandering (planform adjustment) and/or downcutting (geometric adjustment) and the relative sediment supply would decrease in an incising reach. This qualitative analysis provides a basis for more quantitative analyses.
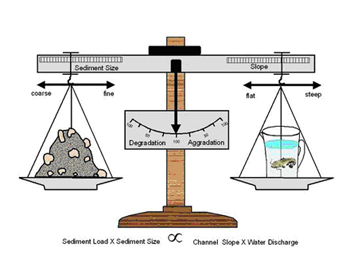
Channel Planform Channel planform is evaluated to assess the condition of stream meanders and the tendency of the channel to migrate laterally. Channel planform characteristics are most readily assessed using historical aerial photography and mapping. The most commonly used geomorphic planform variables are:
- Sinuosity
- Meander Amplitude and Belt Width
- Meander Wave Length
- Meander Arc Length
- Meander Radius of Curvature
- Meander Arc Angle
- Riffle-Pool Spacing
- Channel Width
Channel Sinuosity and Meander Belt
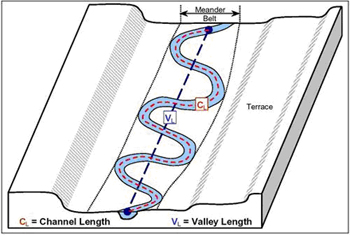
Sinuosity is the ratio of the length of the centerline of the channel (CL) to the length of a line defining the general trend of the valley or stream reach (VL) and describes the amount of meandering in a stream.
Sinuosity = CL / VL
Channel Planform Characteristics
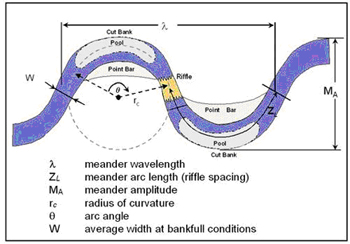
Some commonly used relationships for planform in natural stable systems are as follows:
- 10 to 14W
- Riffle spacing 5 to 7W or ½
- rc 2 to 3W
In general pools are located in bends, riffles are located near crossings. It should be noted that the relations for wavelength and radius of curvature have been most often been identified in stable natural systems and should be used with discretion in the urban environment. This is because impervious watershed conditions accelerate the erosion process and can cause a shift from the natural condition. However these relationships are used as a starting point for many channel reconstruction projects. They can be used to determine whether a system is “out-of-phase” and provide design targets for stabilization projects. From historical observation and common planform relationships the Stream Restoration staff are able to ascertain the probability of bank retreat in a particular area.
Channel Geometry and Profile Channel geometry refers to the cross sectional and longitudinal parameters that affect the amount of channel conveyance and hydraulic forces on the channel boundary. Some common channel geometry parameters are:
- Channel Width
- Flow Area
- Hydraulic Radius
- Hydraulic Depth
- Depth of Flow (maximum depth)
- Width/Depth Ratio
- Bank Height
- Channel Profile
The channel geometric parameters vary throughout a stream reach depending on location these can be averaged to estimate the "reach-average" conditions for certain types of evaluation and analysis.
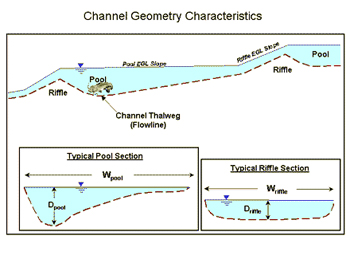
Relationships that relate channel geometry to hydrology are termed “regime equations” and are based on observations of a large group of streams. These relationships usually take the form of:
- W = aQb
- d = cQf
- V = kQm
- S = fQz
For width (W), depth (d), velocity (V) and slope (S)
As with planform channel geometric relations are only relevant in stable systems and should be used with discretion in the urban environment. In areas with rapid land-use change such as developing watersheds relationships such as these may be useless for design. However they may be used for comparative purposes. In older or undeveloped watersheds they may prove more functional. In general more detailed analyses are required to determine appropriate stable channel geometry in areas where watershed land use has been altered.
Drainage area is also used as a surrogate to discharge in channel geometry relationships. It has been observed that the trend is and upward shift in the relationship for channel width to drainage area as a result of urbanization.
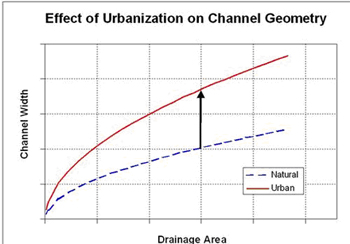
The channel adjustment process resulting from urbanization can also be expressed with incised channel evolution model proposed by Schumm (1984).
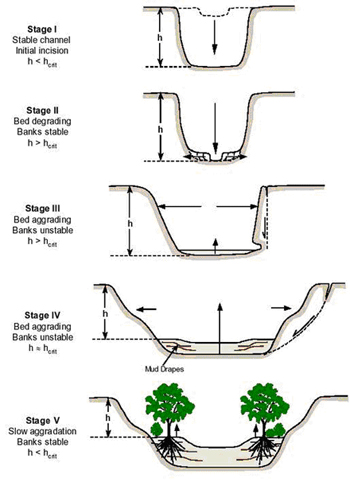
The critical bank height at which mass failure begins is described as hc. when the bank height (h) exceeds hc (Stages II - III) geotechnical failures can be expected.
Observations in Austin indicate that the progression from Stage I to II occurs quite rapidly (10- 30 years) and the widening and restabilization process (Stage IV – V) occurs over a much longer time frame. Most of our urban streams that have been impacted are currently in stages II & III. This identification allows us to utilize other empirical and analytical methods appropriately. The channel evolution model serves to tell us:
- Where the Channel has Been
- Where the Channel is in its Evolution
- Where the Channel is Going
It is important to identify the channel stage of evolution in order to develop appropriate mitigation strategies and reduce future adverse impacts.
Bed Material Characteristics The size, shape, composition and distribution of material in the channel bed are important to the channel stability. These characteristic are used to determine the mobility of the channel bed and subsequently the erosion potential. In general larger sediment sizes (cobbles/boulders) act to stabilize the channel bed, where smaller particles (sand/silt) are more readily erodible. The distribution of particle sizes in bed material mixtures affects the ability of water to mobilize these sediments. The characteristics of the bed material are analyzed through visual observation and gradations developed from sieve analyses or pebble counts.
Bed Material Gradation Curve
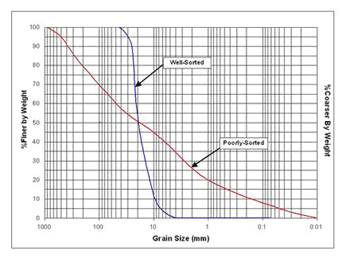
A well-sorted sediment mixture consists of grains that are of uniform size and a poorly-sorted sediment contains particles of many sizes. A poorly-sorted sediment may be indicative of a high energy/flashy system. A poorly-sorted stream may also include large particles that armor the channel bed.
The shape of the bed material affects its stability. Angular particles will provide more stability than rounded particles because of the interlocking and friction characteristics.
The chemical composition of the bed material particles affect how it breaks-down, changes size and shape as the material moves downstream. Weaker materials such as shale and limestone degrade faster than quartz-based sediments.
Bank Composition The type of material and stratigraphy in a channel bank affects its erosion potential. Bank stratigraphy is identified and measured in the field. Geotechnical analyses are performed to analyze the strength characteristics of the bank materials. Many channels in Austin are comprised of composite channel banks with bedrock, clay, alluvium and soils.
Composite Channel Bank in Shoal Creek
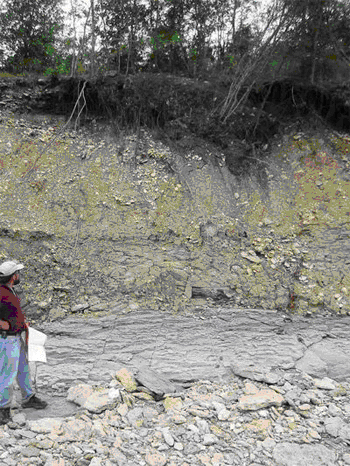
Composite Channel Bank in Onion Creek
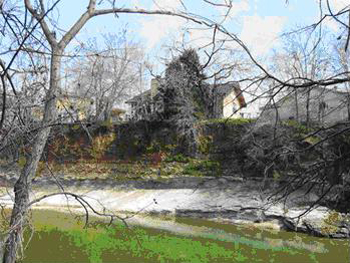
Riparian Vegetation Vegetation acts to provide channel stability as the root systems strengthen the bank material and resist erosive forces. Deep rooted plants and trees give internal strength to the soil mass comprising the channel bank. Shallow rotted plants such as grasses provide more erosion resistance to surficial forces from flowing water. In addition riparian vegetation is an essential component of the aquatic ecosystem.
Roots in the Channel Banks
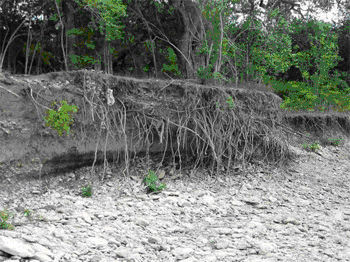
Geotechnical analyses are used to determine existing bank stability, anticipate bank failures and to provide design parameters for embankment construction. Bank failure can occur in various modes depending on the bank soil properties and the morphology of the stream. Some bank failure modes include shallow, planar, rotational and cantilever type failures. The most common type of bank failure in our urbanized stream results from removal of soil from the channel toe (undermining) and subsequent slope failure.
Bank Failure Modes


In design of bank stabilization projects the primary components of a slope stability analysis include evaluation of:
- External Stability
- Internal Stability
- Local Stability
- Global Stability
External stability refers to the acting and resisting forces adjacent to stream that influence stability of the constructed slope. External stability analysis evaluates forces related to bearing capacity, base sliding and overturning moments.
Internal stability refers to forces within the channel bank that affect the stability of reinforcements (internal sliding, tensile overstress, and pullout).
Local stability is related to the surficial facing of a channel bank. This also relates to the connection strength between the facing and internal reinforcements in a constructed slope.
Global Stability relates to deep seated rotational failures that are generally outside the limits of a constructed slope.
The amount and type of data obtained for a stream stabilization project depends of the extent of the problem, the geomorphic physical process affecting the system, variability within the problem area and the type of solution envisioned for the project.
The Stream Restoration Program’s objective is to create a stable stream system that decreases property loss from erosion and increases the beneficial uses of our waterways. In this context a stable channel is one that maintains its plan form, profile and channel geometry without excessive erosion or deposition.
Rock riprap is a layer of loose rock used to protect soil from the erosive or scouring flows of water. Rock riprap is sometimes used for bank protection or bed stabilization in stream restoration projects where other erosion control techniques are not appropriate.
In order for the rock riprap to properly function, installing rock of good quality and the proper size gradation is important. Design criteria for rock riprap are listed in the Environmental Criteria Manual (ECM) Section 1.4.6. Rock riprap materials and construction methods are described in City of Austin Standard Specification 591S.
The Watershed Protection Department recommends a field gradation test method for use during construction projects to verify that the specified rock will be installed. The gradation test method is described in the following documents, and an example analysis worksheet is provided. However, engineers may use an alternate preferred method conforming to ECM Section 1.4.6.
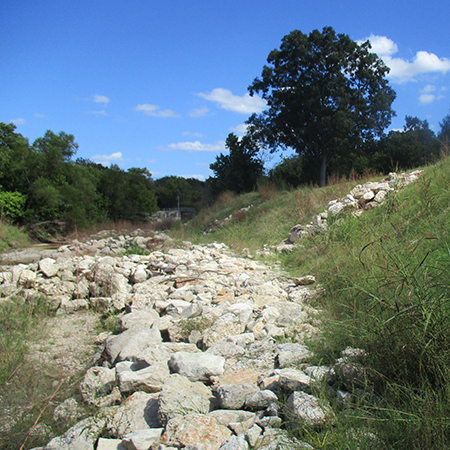
- Topographic and Bathymetric Survey
- Bed Material Pebble Counts and/or Sieve Analyses
- Geotechnical Borings and Soil Strength Testing \
- Historical Aerial Photography
- Historical Comparative Channel Cross Sections and Profiles
- Existing Hydraulic and Hydrology Models and Floodplain Information
- Watershed Mapping (GIS)
Components of the engineering analysis for stream stabilization projects include hydrologic and hydraulic modeling, geomorphic analysis, sediment transport analysis, channel adjustment modeling, and geotechnical analysis. The level of engineering analysis for a stream stabilization project is dependent on the size of the problem and solution type to be implemented.
The stream assessment is used to determine the key factors causing the stream instability. This identification may be used to assess whether a long-term solution may be provided on a site-specific, reach based or watershed-scale approach. Constraints such as budget, land availability and temporal factors also significantly affect the type of solution envisioned.
The Stream Restoration Program utilizes both traditional and innovative design techniques to provide channel stability while enhancing natural channel variability to the extent possible. To the extent practical we utilize a natural channel design approach while meeting the ultimate channel stability goals. The attempt in natural channel design is to:
Design with nature - rather than against it and allow the river to participate in its own recovery.
Imitate natural systems - in particular their morphological variability, rather than a rigid homogenous design.
Scientific basis - is a balance between empirical-statistical and analytical (process-based) methods.
Natural channel design includes manipulation of the channel planform, geometry and profile to minimize the amount of hard armor required to provide channel stability. The primary components of stable channel design include consideration of:
- Reach-Average Channel Geometry (Width, Depth, Slope)
- Local Channel Geometry (Composite/Uniform Shape, Pools Riffles)
- Channel Planform
- Bed and Bank Stabilization
- Grade Control
- Local Scour
Space constraints and infrastructure in the urban environment may limit the amount of channel geometry and planform manipulation that can be provided to achieve stability. Beyond these adjustments, channel stabilization and armoring techniques are employed. The primary components of channel stabilization considerations include:
- Bank Stabilization
- Grade Control
- Channel Bed Armoring
- Toe Protection
- Flow Training Structures
Bank Stabilization The Stream Restoration Program encourages use of natural materials for bank stabilization. The combined use of structural elements, i.e., boulders, reinforcing grid, geocells, fabrics, soils and vegetation, create a stable streambank that is resistant to internal and external forces. These stabilization techniques provide flexibility in structure, aesthetic appeal, habitat benefits and potential cost savings over traditional methods.
Conceptual Streambank Stabilization Design
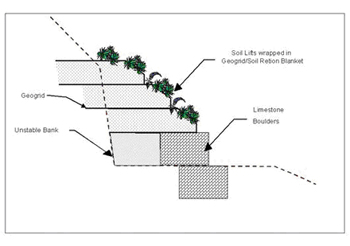
Streambank Stabilization Design Drawing
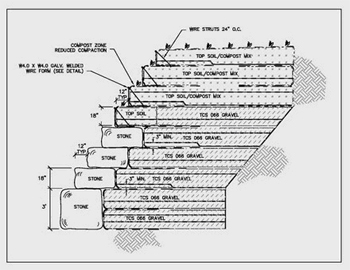
Grade Control
Grade control is used to inhibit long-term channel degradation which occurs through general incision, head-cutting and nick point migration. Grade controls act as hard-points (artificial geology) in the system.
Conceptual Grade Control Design
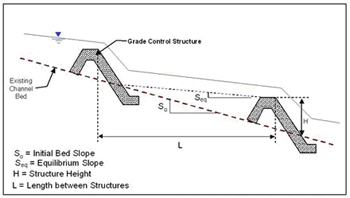
Grade controls are designed with stable materials that should not move during extreme flood events. Grade controls can be designed with rocks, boulders, concrete or other materials. A natural channel design approach is “constructed riffles” using rock placed in a similar configuration as natural riffles. The Stream Restoration Program frequently uses limestone boulders for construction of these structures.
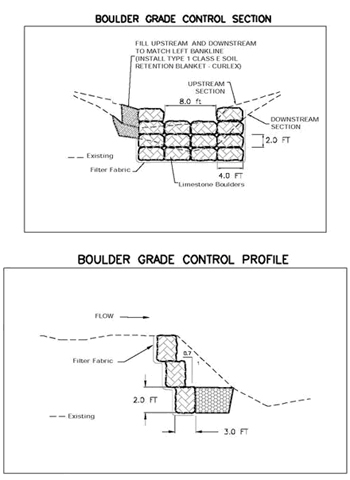
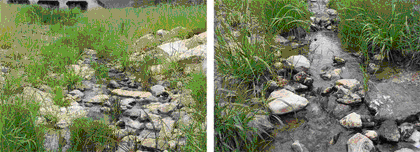
Channel Bed Armoring Channel bed armoring refers to placing stable materials continuously throughout a design reach. Traditionally rubble riprap, gabion mattress or concrete have been used by others. The Stream Restoration Program attempts minimize the extents of channel bed armoring when conditions allow. Alternately a series of grade control structures is encouraged instead of continuous channel armoring to allow as much of the native channel bed material to exist.
Toe Protection A critical element to any channel stabilization project is providing protection of the channel toe. Experience shows that this is the initial point of failure and subsequently bank collapse occurs. Toe protection may be provided with a variety of materials including rock riprap, boulders, biologs, etc. The Stream Restoration Program encourages the use of native materials, but toe protection is included in virtually every channel stabilization project.
Flow Training Structures Flow training structures act to alter the flow pattern and divert flow away from a channel bank or structure to be protected. This can be a more cost-effective alternate to continuous bank stabilization in areas where more space for channel adjustment may be allowed. Some common types of flow training devices are spurs and bendway weirs, which are constructed transverse to the flow path. The function is to act as flow deflectors and between which sediment deposition may occur.
Conceptual Spur/Bendway Weir Field
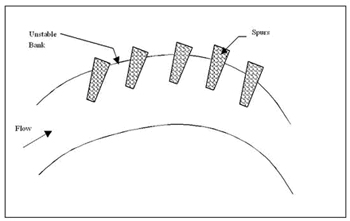
Bendway Weir Design Drawing
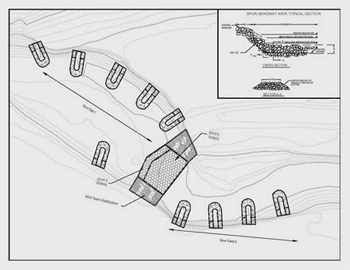
Family Clean Creek Camp
No, we cannot accommodate younger children.
No, this is a parent/child camp. Your child may attend with a friend’s parent or babysitter (over age 18).
Yes, there is a high demand to attend camp so please be committed to attending the full week.
Various sites around Austin. Refer to directions.
Flood Early Warning System
Check the ATXfloods for road closures. NOAA All Hazards Weather Radio will alert you to flood warnings and evacuations. Also, local TV and radio stations often keep you posted during flooding conditions.
Check ATXfloods for road closures.
The City may use a number of different methods to announce an evacuation, including: • NOAA All Hazards Weather Radio • Local Radio and TV • Door to door • An automated phone call with a recorded message to landlines or registered cell phones.
Please keep in mind that floods can happen faster than emergency personnel can respond, so you should monitor the situation yourself as well. There may not be a warning from the City.
Flood Early Warning System, Flood Safety
You don’t. It is not possible to tell if a flooded low water crossing is safe just by looking at it. Approximately 75% of all flood fatalities occur in vehicles. Shallow water can be deceptively swift and easily wash your vehicle off the road. Water over a roadway can conceal damage to the roadway or supporting structure. You may find that there is no longer a road under the water. When a low water crossing is flooded, don’t chance it. Turn Around - Don’t Drown!
Yes, it is a Class B misdemeanor in Texas to drive around a barricade at a flooded road. This is the same as a DWI. If caught, you may be arrested, have your car impounded, spend up to 180 days in jail and/or be fined up to $2000. You may also be charged for the cost of your rescue.
ENS stands for Emergency Notification System. These areas have been identified by the City as being more likely to require evacuation due to flash flooding than other areas. The areas have been pre-entered into our emergency notification system to expedite automated phone calls in the event of an evacuation.
If a road is flooded, turn around and find an alternate route. Don’t risk drowning by trying to cross it. Most flood fatalities occur in vehicles.
This question is impossible to answer except in hindsight. When someone dies, there is a temptation to think the result might have been different if they had just stayed in the car or had just managed to get out of the car. Calling 9-1-1 when your vehicle first stalls has helped some people survive. The best thing is to avoid this situation, by turning around if a road is flooded. Better yet, avoid driving in heavy rainfall, since sometimes visibility is so poor, it is hard to see that a road is flooded.
In the right circumstances, almost any road can flood. The ones listed below are the ones that flood most frequently:
- W. 12th St. from Lamar to Shoal Creek Blvd.
- W. 32nd St. at Hemphill Park
- E. 38 1/2 St. between Grayson and Airport Blvd.
- Adelphi Ln. between Scribe Dr. and Waters Park Rd.
- E. Alpine Rd. between Willow Springs and Warehouse Row
- Burleson Rd. between U.S. 183 and FM 973
- Carson Creek Blvd. between Cool Shadow Dr. and Warrior Ln.
- Colton-Bluff Springs Rd. by Alum Rock Dr.
- Convict Hill Rd. between Flaming Oak Place and MoPAC
- David Moore Dr. north of Sweetwater River Dr.
- Delwau Ln. at Shelton Rd.
- W. Dittmar between Loganberry and S. Congress
- Joe Tanner Ln., near Hwy. 290
- Johnny Morris Rd. between FM 969 and Loyola Ln.
- Lakewood Dr., 6700 block
- W. Monroe St. between S. First and Roma St.
- McNeil Dr. between Camino and Burnet
- Nuckols Crossing at Teri Rd.
- Parkfield Dr. from Thornridge to Mearns Meadow
- Possum Trot between Inland Place and Quarry Rd.
- Old Bee Caves Road, near Hwy. 290
- Old San Antonio Rd. between FM 1626 and IH 35
- Old Spicewood Springs Road, between Loop 360 and Spicewood Springs Rd.
- O’Neal Ln., between MoPAC service road and Waters Park Rd.
- Posten Ln., 7900 block
- River Hills Rd., off Cuernavaca
- Rogge Ln. between Ridgemont and Delwood Dr.
- Rutland from Mearns Meadow to N. Lamar
- Spicewood Springs Road, between Loop 360 and Old Lampasas Trl.
- Springdale Rd. from Ferguson to Breeds Hill Dr.
- Wasson Rd. near S. Congress Ave.
- Waters Park Rd. between 183 and MoPAC
To find out if a road is flooded, check www.ATXfloods.com.
Flood Early Warning System, Local Flooding
The 100-year storm is an event that has a 1% chance of occurring in any given year. To put that in perspective, during the span of a 30-year mortgage, there is a 26% chance that a 100-year event will occur.
The amount of rainfall necessary to produce a 100-year storm is partially dependent on the duration of the storm. If the rain falls over the course of 3 hours, it takes about 6 inches for it to be classified as a 100-year rainfall. But if those same 6 inches fall over the course of 3 days, it would be considered a much smaller rainfall event. The standard 100-year design storm for the City of Austin has a duration of 24-hours and produces a total rainfall of over 10 inches. To learn more about rainfall return periods in Austin, see section 2 of the Drainage Criteria Manual.
During a large storm, it is normal for the intensity to vary widely across the city. In September 2010, Tropical Storm Hermine produced rainfall totals equivalent to a 100-year storm over portions of the Bull Creek watershed. However, other areas of Austin did not experience as severe a storm. Keep in mind that even if a large storm has recently occurred, there is the same percent chance of an equally large storm occurring the following year.
Local Flooding, Flood Early Warning System, Flood Safety
Turn Around - Don’t Drown. Approximately 75% of flood fatalities occur in vehicles. Try to avoid driving during heavy rainfall. If you must drive, look for water over the road, avoid low water crossings, and turn around if a road is barricaded or if there is water over the roadway. Keep in mind that at night, during heavy storms, it may be difficult to see that a road is flooded.
There are many other dangers during a flood as well. In general, stay away from creeks and drainage infrastructure during rainfall.
There is more information about flood safety on our Flood Safety and Preparedness page.
Floodplain Management , Flood Safety
• Risk of Property Damage: If your home is in the 100-year floodplain, it has a 26% chance of being flooded over the course of a 30-year mortgage. There are steps you can take to reduce property damage. For more information, visit www.floodsmart.gov, explore our FAQs or call our hotline at 512-974-2843.
• Safety: Flooding can be deadly. Monitor the weather, consider purchasing a NOAA Weather Radio and prepare a family disaster plan. Learn more about where the floodplain is located on our interactive floodplain map. For more information about flood safety, visit our Flood Safety and Preparedness page.
• Restrictions: Stricter permit regulations apply for any building, remodeling, construction or other development on properties in the floodplain. In some cases, it may be impossible to get a permit. For more information on restrictions, go to Floodplain Development Information.
Local Flooding, Flood Safety
Consider buying flood insurance if you do not already have it. You can take simple steps to protect your possessions by storing important papers, photographs or valuables in watertight containers, placed on a high shelf. In addition, there may be some improvements that you can make to protect your house or business from flooding. For more information, call our hotline at 512-974-2843 or send an email.
If flooding is imminent and you have time, the following steps can limit damages:
- Turn off all utilities at the main power switch and close the main gas valve if evacuation appears necessary.
- Move valuables, such as papers, furs, jewelry, and clothing to upper floors or higher elevations.
- Fill bathtubs, sinks, and plastic soda bottles with clean water. Sanitize the sinks and tubs first by using bleach and rinsing.
- Bring outdoor possessions, such as lawn furniture, grills, and trash cans inside, or tie them down securely.
Download these FEMA publications to find out more about protecting your property:
- Protecting Manufactured Homes from Floods and Other Hazards
- Homeowner’s Guide to Retrofitting: Six Ways to Protect Your Home from Flooding
- Engineering Principles and Practices for Retrofitting Flood-Prone Residential Structures
- Above the Flood: Elevating your Floodprone House
- Protecting Building Utilities from Flood Damage
Floodplain Management
The City conducts engineering studies to determine the extent of the regulatory floodplains. We use historical rainfall information, aerial photography, ground surveys, and engineering computer software to complete these studies. We update floodplain studies about every 10 years.
In some cases, the area of land subject to flooding has not changed, but we have now have better information to base predictions on where the flooding is likely to occur. During floodplain studies, we gather more information about topography, elevations, bridges and the amount of impervious cover.
The City does not grandfather development from using the best available floodplain information. If your property is shown to be in the floodplain with the new study, then you may be grandfathered for flood insurance premiums, but will no longer be eligible for a preferred risk policy. Visit www.floodsmart.gov to learn more about flood insurance or contact your insurance agent.
Our current studies will follow the FEMA process for revision of floodplain maps.
- Information Gathering: Surveyors and engineers collect information in the field and from construction plans.
- Engineering and Mapping: Engineers and technical staff will then incorporate the new survey data into the current floodplain models to produce draft floodplain maps.
- Stakeholder Meetings: The draft floodplain maps and supporting engineering data are presented to community and stakeholders.
- Production and Distribution of Preliminary Maps: Based on comments received during stakeholder meetings, the City produces preliminary floodplain maps and prepares them for distribution to the community.
- Public Meetings and Appeal Period: The preliminary maps are made available to the public. There will be an opportunity for the public to review and formally appeal the maps.
- Production of Final Maps: Appeals and protests are reviewed and revisions made to the maps if justified.
- Adoption of Revised Maps: Maps are officially adopted by FEMA and the City of Austin.
The City conducts engineering studies to determine the extent of the regulatory floodplains. We use historical rainfall information, aerial photography, ground surveys, and engineering computer software to complete these studies.
The reason for the remapping effort is specific to each watershed. Please download the flyer for the watershed you are interested in for more information. The watersheds are listed on the Floodplain Management page. You can download a flyer by clicking on the watershed name.
Depending on how much rain there’s been, Austin’s creeks may be bone dry, gently flowing with water or a raging torrent. The floodplain is the area of land that is likely to be under water when the creek rushes over its banks. In a sense, the floodplain is the full extension of the creek.
The 100-year floodplain is the land that is predicted to flood during a 100-year storm, which has a 1% chance of occurring in any given year. You may also hear the 100-year floodplain called the 1% annual chance floodplain or base flood. Areas within the 100-year floodplain may flood in much smaller storms as well. The 100-year floodplain is used by FEMA to administer the federal flood insurance program and the City of Austin to regulate development.
The FEMA floodplain maps are used for administering flood insurance. FEMA floodplains are based the conditions that existed at the time of the floodplain study, including buildings, parking lots, driveways, bridges, culverts and channel geometry.
The City of Austin regulatory floodplain is used for development and building permits. Its floodplains are based on fully developed conditions. In other words, all of the land area is assumed to be fully built out with the maximum impervious cover currently allowed by zoning. Generally, the regulatory floodplains cover a greater area of land than the FEMA floodplains. In some cases, for example in the urban watersheds, the FEMA and City of Austin floodplains are exactly the same.
The restrictions protect lives and properties. They ensure that development doesn’t cause additional flooding on other properties. In addition, they ensure that the development itself minimizes the risks of flooding. Many of the development restrictions are federal requirements in order for Austin citizens to be able to purchase federally-backed flood insurance from FEMA.
Groundwater
Barton Springs has been called "the soul of Austin" with a history of human activity that dates back at least 10,000 years. It is the main discharge point for water that enters the Barton Spring segment of the Edwards Aquifer.
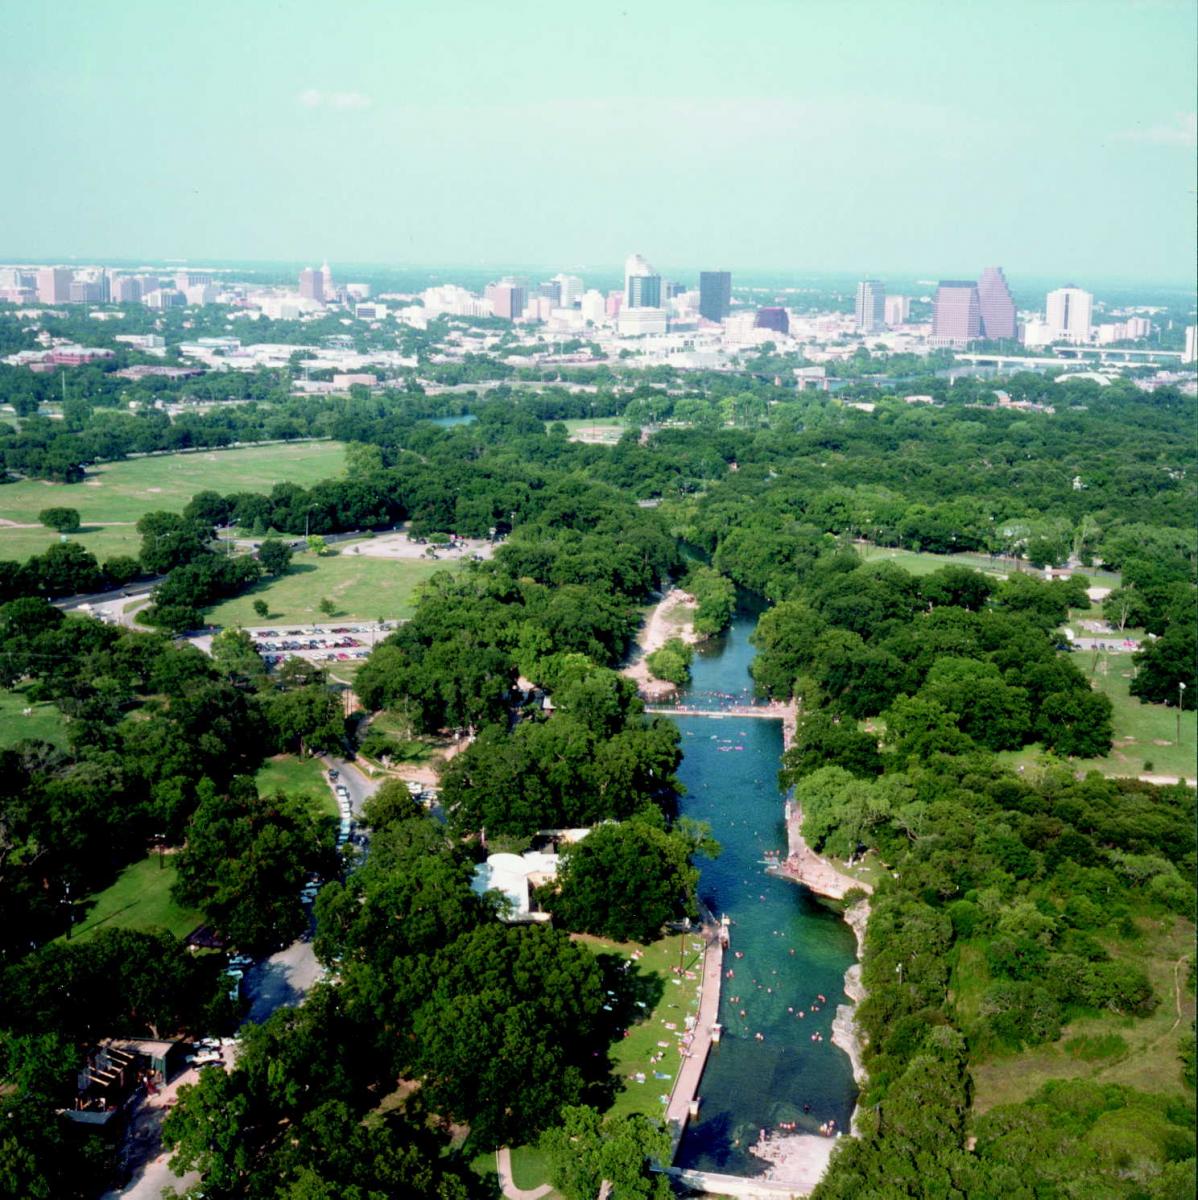
Monitoring water quality at Barton Springs is essential for assessing the cumulative impact of development on the entire Barton Springs Edwards Aquifer as well as for endangered species protection and preservation of the unique swimming site. An automatic sampler is stationed at Barton Springs to collect data on pH, temperature, turbidity, specific conductivity, dissolved oxygen, and depth. Watershed Protection groundwater monitoring staff test for suspended solids and nutrients every two weeks. Additionally, twice weekly, and following rainfall over one inch, the Parks and Recreation and/or County Health Departments test for bacteria levels.
Barton Springs is actually comprised of four separate but related spring outlets.
- Main Barton Springs, also known as Parthenia, discharges from the aquifer directly into the pool from numerous fractures and openings upstream of the diving board area. This is also where the endangered Barton Springs Salamander is primarily found.
- Eliza Spring discharges into a concrete amphitheater on the north side of the pool near the concession stand. Water is visible welling up from holes drilled into the artificial concrete floor.
- Old Mill Spring (Sunken Garden), also known as Zenobia Spring, discharges into a stone-walled pool on the south side of the creek downstream of Barton Springs pool and flows through a short tributary to Barton Creek.
- Upper Barton Springs is located upstream of Barton Springs Pool.
Groundwater tracing is a commonly used technique to understand water movement through karst aquifers like the Edwards. The dissolution of limestone occurs slowly over a long period of time and these opening are pathways or conduits for water to enter the aquifer and for groundwater to move through the aquifer. Tracing can use naturally occurring chemical in the water, introduced chemicals or dyes to track water movement. A tracer is typically introduced into the aquifer through a naturally occurring recharge feature and wells, springs and other water ways are monitored to detect the tracer.
A coordinated tracing program began in the Barton Springs Edwards Aquifer in 1996. Since that time, over 30 traces have been conducted. A special project began in 1996 in conjunction with the Barton Springs/Edwards Aquifer Conservation District (BS/EACD) called the Barton Springs Zone Dye Trace Study. Dye was injected into caves and sinkholes to map water movement in this segment. The goals were to trace the water going into the aquifer at various points in the recharge zone, measure flow rates, and determine which wells and springs the water would emerge from. Travel rates from recharge points to springs varied from 4 miles/day to 0.25 miles/day. Onion Creek is the largest contributor of the watersheds to Barton Springs under normal conditions, but a 2017 study shows that the Blanco River can be a significant source of recharge during drought conditions.
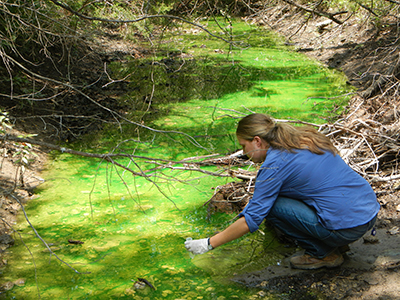
The Edwards Aquifer is an underground layer of porous limestone that stores water. While the Edwards stretches from Temple to Del Rio, the Barton Springs segment is of most interest to Austinites since the water re-emerges near the heart of downtown at Barton Springs.
Download our aquifer brochure to learn more about aquifers and click here to visit the Edwards Aquifer page.
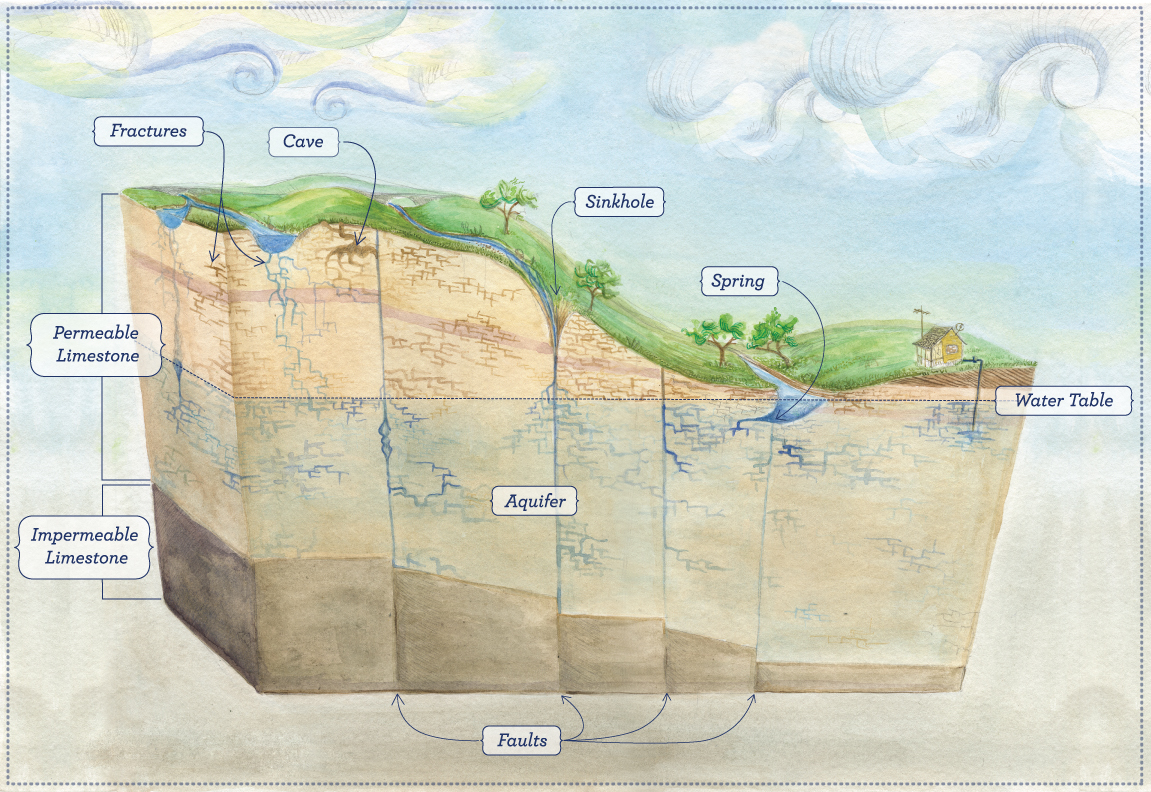
Environmental Assessments can range from field checks of karst features for development projects submitted to the City for review to extensive surveys of undeveloped ranches to map and document karst features.
- Development Review
- Environmental Inspection
- Environmental Criteria Manual
Groundwater monitoring staff collect quarterly samples from six springs in the Barton Springs segment of the Edwards Aquifer: Parthenia in Barton Springs Pool, Eliza, Old Mill (Sunken Garden), Upper Barton, Backdoor and Cold.
The Barton Springs segment of the Edwards Aquifer (BSEA) is an important resource for the Austin area. It supplies drinking water to wells for numerous communities, provides habitat for endangered species, provides clean base flow to the Colorado River and supplies the City of Austin with part of its drinking water supply. Large rain events fill or "recharge" the aquifer, which feeds Barton Springs. Recharged water can begin discharging from Barton Springs in a matter of hours.
The City of Austin, the U.S. Geological Survey (USGS) and Barton Springs/Edwards Aquifer Conservation District (BS/EACD) coordinate an annual sampling program for BSEA wells and Barton Springs. Automatic data loggers are stationed to monitor impacts from rain events, discharge rates and seasonal effects.
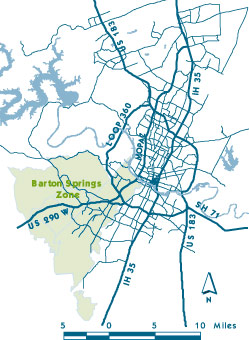
The U.S. Geological Survey’s website allows you to customize your search for this data related to spring discharge and well water levels.
Grow Green
Using earth-wise practices can save you time, energy, and money while helping to protect our precious water resources – our streams, lakes, and aquifers.
Click here to view all the Grow Green fact sheets.
Haga clic aquí para ver nuestras hojas informativas en español
Click here to subscribe online to be notified by mail about gardening classes or call 512-974-2550 and ask to be put on the emailing list for gardening classes. You will receive notification when a gardening class is scheduled. We usually offer classes a couple of times a year. Please also check the Grow Green home page occasionally. We post classes from multiple City departments and the Travis County Master Gardeners - but will not be sending out announcements for those classes individually.
The Native and Adapted Plant Guides were developed for City of Austin residents.
Anyone:
Access it online in a Downloadable or Searchable database format
Citizens of Austin and Travis County:
It is available for free to Austin and Travis County residents.
Option One: Pick up a copy at a Grow Green distribution location.
Plant guides are distributed free of charge at participating Austin-area Grow Green partner retail & wholesale nurseries, home improvement centers, non-profits, and City of Austin locations. Click here for a map of distribution locations.
We strongly suggest you call ahead to check distribution location hours and ensure they have them in stock.
Option Two: To find out about availability and obtaining plant guides, please contact Nicole Miller at Nicole.Miller@austintexas.gov
Visit www.austintexas.gov/gardengoodies to learn more about gardening-related rebates, grants, and free stuff available from the City of Austin for residential, multi-family and homeowner associations, community groups, commercial and other properties.
- Start with a plan
- Analyze your site
- Properly locate plants
- Use native & well-adapted plants
- Do not plant Invasive plants
- Plant trees
- Conserve water
- Use mulch
- Irrigate efficiently
- Minimize turf areas
- Use integrated pest management (IPM), least toxic choices to address pests
- Accurately diagnosis plant problems
- If you have turf, practice earth-wise Lawn Care
- Avoid "Weed & Feed"
- Compost
- Fertilize only if needed
- Keep Austin Wild! Promote wildlife
- Support community gardens
- Use sustainable building materials
- Leave grass clippings on lawn, they return nutrients
The program is a partnership between the City of Austin and the Texas AgriLife Extension Service. All materials are designed by the City using the technical expertise of the Texas AgriLife Extension Services and city staff. The City manages the program and the AgriLife Extension Service assists with distribution of materials in Ausin and parts of Travis County.
As of September 12, 2014, the priority for the distribution of Native & Adapted Plant Guides, paid for by Austin citizens, are Grow Green nurseries and program partners. As a courtesy, we sell them to businesses and entities outside of Austin, but we reserve the right to limit the sale, when the inventory is low or an anticipated high demand period is expected. When sales are allowed, the maximum number of boxes will be 2 per organization
Formalized on October 14, 2013
The City of Austin Grow Green program partners with Austin nursery businesses to provide the public with information about earthwise landscaping and management of common landscape pests. The information is intended to help protect water resources by reducing the amount of pesticides that enter our waterways.
The materials are provided and distributed free to Austin-area businesses that sell plants, pesticides or both. They are provided at the point-of-sale to educate people about plant selection and integrated pest management alternatives, with emphasis on the least toxic, most effective solution. Materials are also all available electronically at www.growgreen.org.
Program Materials:
- Grow Green Native and Adapted Landscape Plant guide – The plant guide highlights native and adapted plants that do well in Central Texas’ environment.
- Grow Green Fact Sheet series/display - The Grow Green fact sheet series provides least toxic options for the most common Austin-area landscape pests and other general landscaping information topics.
- Landscape Design templates – Design templates for landscape designs such as Child Friendly, Classic, and Shade Friendly.
- T-shirts – are provided annually to staff at partnering nurseries
Business Category:
- Plants only: If a business only sells plants they can receive the Grow Green Native and Adapted Landscape Plant guide and have the option to display the Grow Green Fact Sheets and Landscape Design Templates.
- Plants & Pesticides: If a business sells plants and pesticides they are required to carry both the Grow Green Native and Adapted Landscape Plant guide and the Fact Sheets. They have the option to distribute the Landscape Design Templates.
- Plants and only Least-toxic pesticides - if a business only carries products with the least toxic designation (i.e. the lady bug icon featured on the Fact Sheets), they may opt out of carrying the fact sheets. Qualifying businesses that select this option must send the Grow Green Program Coordinator a list of the pesticide products carried at the beginning of the agreement and provide a current list of the pesticides they sell each October. If any pesticides that do not have the least toxic icon are sold then the business will begin to display the Fact Sheets or forfeit receiving any of the Grow Green program materials.
Store Responsibilities
- Identify a Grow Green Single Point of Contact (SPOC)
- The SPOC will:
- let the Grow Green program coordinator know at least one week in advance which program materials need restocking. This information can be emailed or left on a voicemail message at denise.delaney@austintexas.gov or 512-974-2581.
- keep the display organized and clean.
- report any damage to the display.
- contact the Grow Green program coordinator to remove any program materials or displays from the store if participation in the program is no longer desired.
- The SPOC will:
- Stock less-toxic integrated pest management products
- Allow Grow Green training of employees
- Provide feedback on the program
Grow Green Coordinator Responsibilities
- Provide & set up displays
- Provide program materials for restocking displays
- Coordinate trainings
- Follow-up with stores as needed to answer questions
- Provide map of Grow Green partners on the website www.growgreen.org
Native Plants
- Grow Green Plant Guide of Native and Adapted Plants: searchable database, pdf City of Austin)
- Central Texas Recommended Plant List (Lady Bird Johnson Wildflower Center)
- Central Texas Native Plants Image Archive (University of Texas at Austin)
- Native Plant Information Network (Lady Bird Johnson Wildflower Center)
Trees
- Tree Resources (City of Austin)
- Community Trees (City of Austin Development Services Department)
- Native Trees of Texas (Texas A&M University)
- Urban Forestry (City of Austin Parks & Recreation)
- Native Trees on the University of Texas at Austin campus
Landscaping
- Grow Green Program Home Page
- Grow Green Landscape Design
- Water Conservation Tips, Rebates and Tools
- Waterwise Landscape Rebate Program (Austin Water)
Applications are accepted twice per year, December 1 – March 31 for spring installations and June 1 – September 30 for fall installations.
Wildlife Habitats
- Wildlife Austin(City of Austin Parks & Recreation)
- Austin Butterfly Forum
- National Audubon Society
- National Wildlife Federation
- Native Plant Society of Texas’ list of resources for teachers and kids
- Downloadable Flower Masks
- Native Seed Ball Activity Kit available for checkout
Teacher and Kid Resources
- Watershed Protection Department Youth Education
- Downloadable Native Plant Masks
- Native Seed Ball Activity Kit available for checkout
Native Plants
- Grow Green Plant Guide of Native and Adapted Plants: searchable database, pdf City of Austin)
- Central Texas Recommended Plant List (Lady Bird Johnson Wildflower Center)
- Central Texas Native Plants Image Archive (University of Texas at Austin)
- Native Plant Information Network (Lady Bird Johnson Wildflower Center)
Trees
- Tree Resources (City of Austin)
- Community Trees (City of Austin Development Services Department)
- Native Trees of Texas (Texas A&M University)
- Urban Forestry (City of Austin Parks & Recreation)
- Native Trees on the University of Texas at Austin campus
Landscaping
- Grow Green Program Home Page
- Grow Green Landscape Design
- Water Conservation Tips, Rebates and Tools
- Waterwise Landscape Rebate Program (Austin Water)
Applications are accepted twice per year, December 1 – March 31 for spring installations and June 1 – September 30 for fall installations.
Wildlife Habitats
- Wildlife Austin(City of Austin Parks & Recreation)
- Austin Butterfly Forum
- National Audubon Society
- National Wildlife Federation
- Native Plant Society of Texas’ list of resources for teachers and kids -->
- Downloadable Flower Masks
- Native Seed Ball Activity Kit available for checkout
Teacher and Kid Resources
- Watershed Protection Department Youth Education
- Downloadable Native Plant Masks
- Native Seed Ball Activity Kit available for checkout
Native plants are acclimated to local climate conditions and soils, provide habitat for wildlife, typically require less water and maintenance once established, and do not rely on chemical fertilizers and pesticides to thrive. These homegrown plants also give us a sense of place and help maintain the region's wide variety of flora and fauna. Not only do they provide all of these wonderful benefits, but they are beautiful, too!
- City of Austin’s Invasive Plant Webpage
- Invasives Plant Database - To find out if a plant in your area is an aggressive non-native that competes with native plants for resources.
- Austin Resource Recovery
- Austin Energy: Green Building
- Austin Water Utility: Water Conservation and Wildlands
- Parks and Recreation Department: Urban Forestry, Wildlife Austin, Zilker Botanical Garden
- Development Services Department
- Watershed Protection Department: Grow Green
Participating city departments and programs include:
- Office of Sustainability: Climate Protection
- Austin Energy: Green Building
- Austin Resource Recovery: Home Composting Rebate Program, Recycle and Reuse
- Austin Water Utility: Water Conservation, Wildland Conservation and Dillo Dirt
- Parks and Recreation Department: : Nature Preserves, Sustainable Urban Agriculture & Community Gardens, Urban Forestry and Zilker Botanical Garden
- Development Services Department: City Arborist
- Watershed Protection Department: Grow Green, Integrated Pest Management, Austin Invasive Management
Program Partners:
- Travis County AgriLife Extension
- Texas A&M - Aggie Horticulture or Texas A&M homepage
- Grow Green Nurseries and other distribution locations
- Regional and Statewide Activities The Native Plant Society of Texas promotes research, conservation and utilization of native plants and plant habitats of Texas throughout the state and includes Texas Native Plant Week events on their website
The Native Plant Society of Texas promotes research, conservation and utilization of native plants and plant habitats of Texas throughout the state and includes Texas Native Plant Week events on their website.
Grow Green offers 23 fact sheets that help you identify and solve pest and disease problems and provide general landscaping design, installation and maintenance recommendations. It offers a Native and Adapted Plant Guide that recommends 200 plants that not only survive, but thrive in Central Texas. It also provides workshops and technical information to nursery sales associates so that they can better serve their customers. All materials are offered FREE to Austin citizens and the garden centers.
Grow Green and xeriscaping have very similar principles. Xeriscaping is landscaping whose main goal is to conserve water (Water Wise Austin). The seven principles of Xeriscape include: Planning and Design, Soil Analysis, Plant Selection, Practical Turf Areas, Efficient Irrigation, Use of Mulches, and Maintenance. Grow Green goes beyond Xeriscaping in emphasizing the use of least toxic products in the landscape. Minimizing chemical input in the landscape protects our living areas and our water ways.
Native Plants
- Grow Green Plant Guide of Native and Adapted Plants: searchable database, pdf City of Austin)
- Central Texas Recommended Plant List (Lady Bird Johnson Wildflower Center)
- Central Texas Native Plants Image Archive (University of Texas at Austin)
- Native Plant Information Network (Lady Bird Johnson Wildflower Center)
Trees
- Tree Resources (City of Austin)
- Community Trees (City of Austin Development Services Department)
- Native Trees of Texas (Texas A&M University)
- Urban Forestry (City of Austin Parks & Recreation)
- Native Trees on the University of Texas at Austin campus
Landscaping
- Grow Green Program Home Page
- Grow Green Landscape Design
- Water Conservation Tips, Rebates and Tools
- Waterwise Landscape Rebate Program (Austin Water)
Applications are accepted twice per year, December 1 – March 31 for spring installations and June 1 – September 30 for fall installations.
Wildlife Habitats
- Wildlife Austin(City of Austin Parks & Recreation)
- Austin Butterfly Forum
- National Audubon Society
- National Wildlife Federation
- Native Plant Society of Texas’ list of resources for teachers and kids
- Downloadable Flower Masks
- Native Seed Ball Activity Kit available for checkout
Teacher and Kid Resources
- Watershed Protection Department Youth Education
- Downloadable Native Plant Masks
- Native Seed Ball Activity Kit available for checkout
Native Plants
- Grow Green Plant Guide of Native and Adapted Plants: searchable database, pdf City of Austin)
- Central Texas Recommended Plant List (Lady Bird Johnson Wildflower Center)
- Central Texas Native Plants Image Archive (University of Texas at Austin)
- Native Plant Information Network (Lady Bird Johnson Wildflower Center)
Trees
- Tree Resources (City of Austin)
- Community Trees (City of Austin Development Services Department)
- Native Trees of Texas (Texas A&M University)
- Urban Forestry (City of Austin Parks & Recreation)
- Native Trees on the University of Texas at Austin campus
Landscaping
- Grow Green Program Home Page
- Grow Green Landscape Design
- Water Conservation Tips, Rebates and Tools
- Waterwise Landscape Rebate Program (Austin Water)
Applications are accepted twice per year, December 1 – March 31 for spring installations and June 1 – September 30 for fall installations.
Wildlife Habitats
- Wildlife Austin(City of Austin Parks & Recreation)
- Austin Butterfly Forum
- National Audubon Society
- National Wildlife Federation
- Native Plant Society of Texas’ list of resources for teachers and kids -->
- Downloadable Flower Masks
- Native Seed Ball Activity Kit available for checkout
Teacher and Kid Resources
- Watershed Protection Department Youth Education
- Downloadable Native Plant Masks
- Native Seed Ball Activity Kit available for checkout
Native plants are acclimated to local climate conditions and soils, provide habitat for wildlife, typically require less water and maintenance once established, and do not rely on chemical fertilizers and pesticides to thrive. These homegrown plants also give us a sense of place and help maintain the region's wide variety of flora and fauna. Not only do they provide all of these wonderful benefits, but they are beautiful, too!
- City of Austin’s Invasive Plant Webpage
- Invasives Plant Database - To find out if a plant in your area is an aggressive non-native that competes with native plants for resources.
- Austin Resource Recovery
- Austin Energy: Green Building
- Austin Water Utility: Water Conservation and Wildlands
- Parks and Recreation Department: Urban Forestry, Wildlife Austin, Zilker Botanical Garden
- Development Services Department
- Watershed Protection Department: Grow Green
The Native Plant Society of Texas promotes research, conservation and utilization of native plants and plant habitats of Texas throughout the state and includes Texas Native Plant Week events on their website.
Grow Green, Grow Green Resources
Nearly every nursery and some home improvement stores throughout Austin have 23 Grow Green fact sheets and the very popular Native and Adapted Landscape Plant Guide. The information is also available online at www.growgreen.org.
Click here for a map of locations where you can find Grow Green information. The information is also available online at www.growgreen.org.
Grow Green Resources, Landscape Professional Training
February 1, 2012
The presentations and handouts listed here were used as a part of the 2013 Grow Green Landscape Professional Training series and reflect the opinions of individual presenters.
Matt Hollon
-
New Commercial Landscape Ordinance - presentation
- New Commercial Landscape Ordinance - handout
John Gleason
- Rain Gardens - presentation
- Rain Garden Grow Green Fact Sheet - Six Easy Steps to Build a Rain Garden
Kristin Carlton
February 8, 2012
Dr. Mark Simmons
Matt O'Toole
-
MOST WANTED: Top 24 Invasive Species - handout
Michael Embesi
- Native Tree Growing Guide for Central Texas - handout
- Fruit & Nut Tree Growing Guide for Central Texas - handout
February 15, 2012
Brian Bomer
- Green Building & Landscaping - presentation
Drema Gross
- Drought Contingency Plan - presentation
February 22, 2012
Troy Nixon
- Installation - presentation
Woody Raine
- Site-Recycling on Construction Sites - presentation
Alan Watts
- Compost Techniques for Stormwater Quality - presentation
Doug Christensen
- Irrigation Technologies and Alternative Water Sources - presentation
- Irrigation Application Technologies - handout
- Alternative Irrigation Water Sources - handout
February 29th, 2012
Dick Peterson
- Rainwater Harvesting - presentation
Stacy Neef
- Reducing Our Nation's Dependence on Foreign Oil Through Landscape Initiatives - presentation
- Commercial Mower Incentive Program Guidelines - handout
- Pre-Incentive Mower Survey - handout
Daphne Richards
- Non-Traditional Soil Additives - handout
- What Happens to Nitrogenin Soils - handout
March 7, 2012
Dr. David Chalmers
- Turfgrass Selection for Texas - handout
- Turfgrass Establishment in Texas - handout
- Lawn Fertilization in Texas - handout
Hydrilla
Once hydrilla has been introduced into a lake, complete elimination is very difficult. There is no quick fix for hydrilla but control options fall into three basic categories:
- Mechanical controls:
- Remove part or all of the plant either by hand or machine (harvesting)
- This is costly and the plants grow right back, like mowing a lawn.
- Dispose of all plant fragments on shore: Because new plants can sprout from fragments, all plant material cut or collected MUST be removed from the lake. Throwing hydrilla back in the lake can result in a maximum fine of $2000 per plant.
- Winter lake lowering to expose the plant to drying and possibly freezing temperatures
- This only impacts plants in less than 12 ft of water, and doesn’t kill roots
- Remove part or all of the plant either by hand or machine (harvesting)
- Biological methods:
- Introduce fish (sterile grass carp) or insects that eat the plants
- Reintroduce native plants- the City has done this on 20 sites on Lake Austin and Lady Bird Lake, but it takes a long time for the plants to outcompete invasives like hydrilla
- Chemical control using aquatic herbicides to kill the plants. Lake Austin’s depth and constant water flow limit the effectiveness, and due to drinking water intakes and public perception, it has not been an acceptable solution in the past. The City does not recommend this, and private individuals must get approval from TPWD for this action.
September 2013
TPWD’s September 2013 vegetation survey of Lake Austin documented 203 acres of aquatic vegetation, mostly Eurasian watermilfoil (milfoil), which increased from 136 acres in June. The most notable change was the exotic plant hydrilla, which covered 330 acres in June but was not observed at all on the September survey.
Infesting the lake since 1999, this aggressive, invasive plant has posed significant public safety threats as its dense growth impacted flood flows, water intakes and recreation on the lake. It reached a historic high coverage of over 600 acres in February 2013, due primarily to the drought-induced warmer water that the plant prefers. The recent decline is a result of ongoing stocking of sterile grass carp that eat hydrilla, preferring it to other plants like milfoil.
As hydrilla declined, milfoil (a less problematic exotic) has increased and is providing critical ecosystem benefits like aquatic habitat, food and oxygen that helps keep the lake healthy without the extremely dense growth of hydrilla.
It is important to remember that hydrilla is under control but probably not eradicated; over time, the fish population will decline naturally and hydrilla may re-sprout from underground tubers. Changes in water flow and temperature can also impact growth rates, so the City and TPWD will continue to monitor Lake Austin vegetation and implement control efforts as needed.
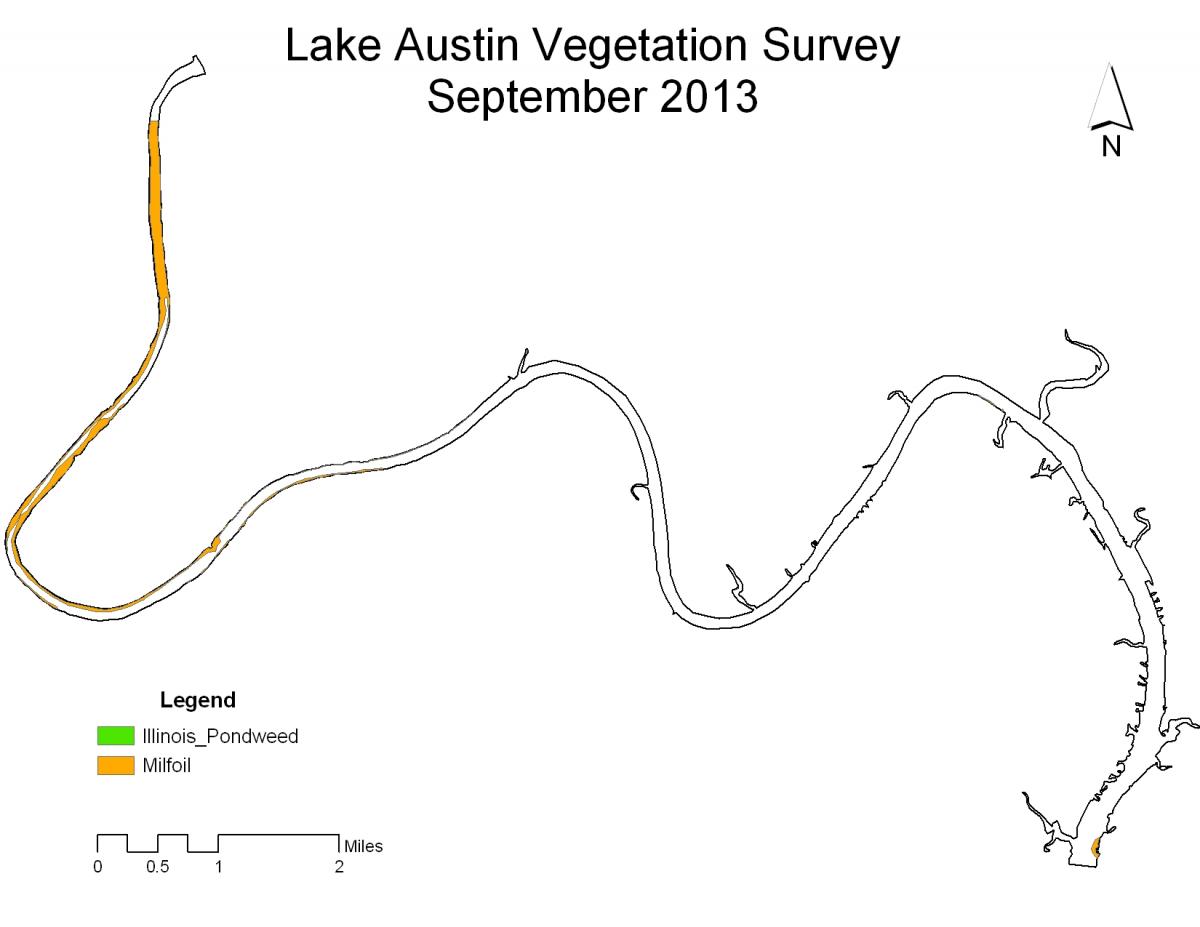
Summer 2013
TPWD’s June survey documented 338 acres of the exotic plant hydrilla on Lake Austin, a decrease from the lake’s historic high of 588 acres in February 2013. As hydrilla decreases, the less aggressive exotic milfoil increased to 136 acre from 60 acres in February, making 474 acres of total vegetative cover on the lake. Most of these plants are concentrated from upstream of Emma Long (City) Park to the headwaters, with hydrilla growing in more than 12 feet of water, and only small areas reaching the surface. This is a significant change since last summer, when hydrilla covered 580 acres, and dense mats impacted recreational use of the lake.
The decrease in hydrilla can be attributed to the stocking of grass carp in the lake, with the latest addition in May 2013 bringing the rate to 55.5 fish per hydrilla acre. The fish had kept hydrilla in check from 2005-2010, and the plant coverage stayed below 80 acres throughout that period. But since 2011, Lake Austin’s warmer water and lower flow (due to drought-stricken Lake Travis) allowed hydrilla to increase steadily, and required an increase in the fish stocking rate to gain control.
The extreme low water level on Lake Travis means there is insufficient water available for re-fill after a lake drawdown, so it is not anticipated that the City will request that LCRA conduct a lowering of Lake Austin in January 2013. If Lake Travis water levels rise significantly in the months ahead, this option can be re-evaluated as additional vegetation control. TPWD will continue to conduct quarterly Lake Austin vegetation surveys, using the results to determine appropriate control actions for hydrilla.

April 2013
TPWD’s February 2013 Lake Austin vegetation survey (see map below) documented over 580 acres of hydrilla (out of 647 acres total plant coverage), a slight increase since last fall’s survey of 554 acres of hydrilla. This increase over the winter prompted TWPD to approve the stocking of an additional 9,000 sterile grass carp, which the City will purchase and stock at Mary Quinlan Park in early April . This fish stocking is part of an ongoing program designed to limit impacts from hydrilla without removing all beneficial vegetation from the lake.
Estimating loss of fish due to mortality and migration downstream, TPWD has determined these additional fish will bring the stocking rate up to 55.5 fish per acre of hydrilla. This elevated stocking rate was recommended to address the drought conditions favorable to the plants (limited flow, warmer water) that are expected to continue throughout this summer. TPWD anticipates surveying the lake again in June or July to measure the impact from the higher stocking rate.
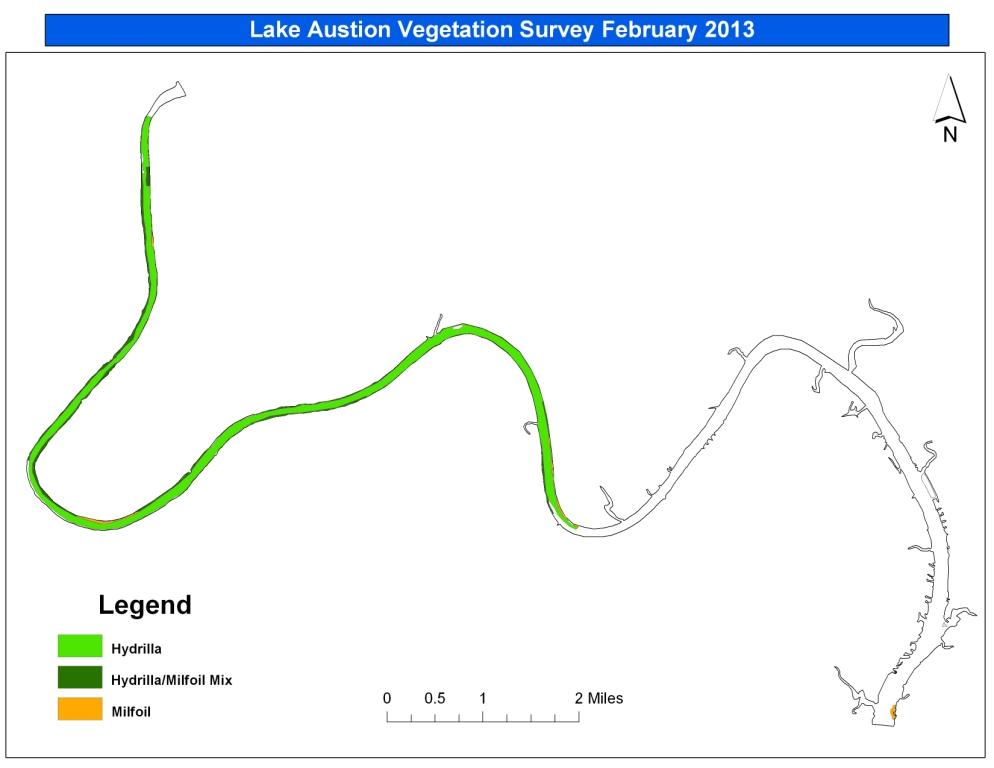
October 2012
TPWD’s September 2012 survey showed a slight decrease in lake vegetation, with 554 acres of hydrilla, down from the April 2012 historic high of 585 acres. As a comparison, during the same period last year, hydrilla increased over 150 acres (see red arrows on graph below). While hydrilla coverage is still of great concern, and is a result of drought-induced warmer water and lower flow in the lake, this downward trend is encouraging, and is most likely due to the ongoing stocking of sterile grass carp.
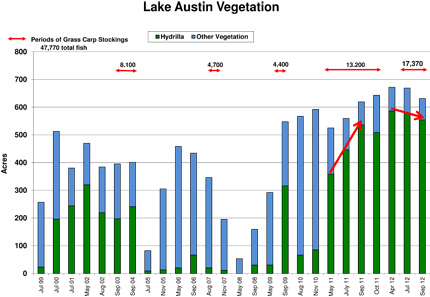
The graph above shows plant growth and fish stocked over time on Lake Austin.
The plants were kept in check from 2005 – 2010 primarily due to the large number of grass carp (fish that prefer hydrilla) stocked. The City will stock 6,000 more grass carp in early November 2012, following this summer’s cooperative stocking of over 11,300 fish. But it will take some time for these newly stocked fish to ‘catch up’ to the increased growth spurred by current environmental conditions.
Over 47,700 fish have been stocked in the lake since the program began in 2003, but with natural mortality and other losses, TPWD estimates the 2012 population to be around 27,770 fish. At current hydrilla coverage, this means there are about 50 fish per hydrilla acre, which is a level TPWD expects to provide control, as coverage has increased whenever the stocking level dropped below that in the past.
While winter drawdowns can provide some control in areas less than 12 feet deep, hydrilla grows in depths well beyond the drawdown’s exposure, and affected plants grow back by the next summer. LCRA has indicated that current water levels on Lakes Travis and Buchanan make a lake lowering unfeasible, but if water levels increase significantly this fall, that option will be re-considered.
June 2012
TPWD approved 15,200 sterile grass carp for use in Lake Austin due to results of the April 2012 survey showing over 585 acres of hydrilla in the lake. This is 50% of the total number of fish stocked in the past nine years, and more fish than were stocked in all of 2011. The City of Austin, LCRA and Friends of Lake Austin have agreed to share the cost of these fish. However, current supplies of grass carp are very limited (2012 has been a banner year for hydrilla growth across the southern United States) so only 10,000 fish can be stocked at this time. The City will release 3,000 of these fish on Wednesday June 20 at Mary Quinlan Park, and the remaining fish will be stocked in subsequent weeks.
May 2012
The April 2012 Texas Parks and Wildlife Department (TPWD) survey showed over 585 acres of hydrilla in Lake Austin, with an additional 86 acres of milfoil and other vegetation, for a total of 672 acres of vegetative cover, a historic high. This map shows the extent of the infestation.
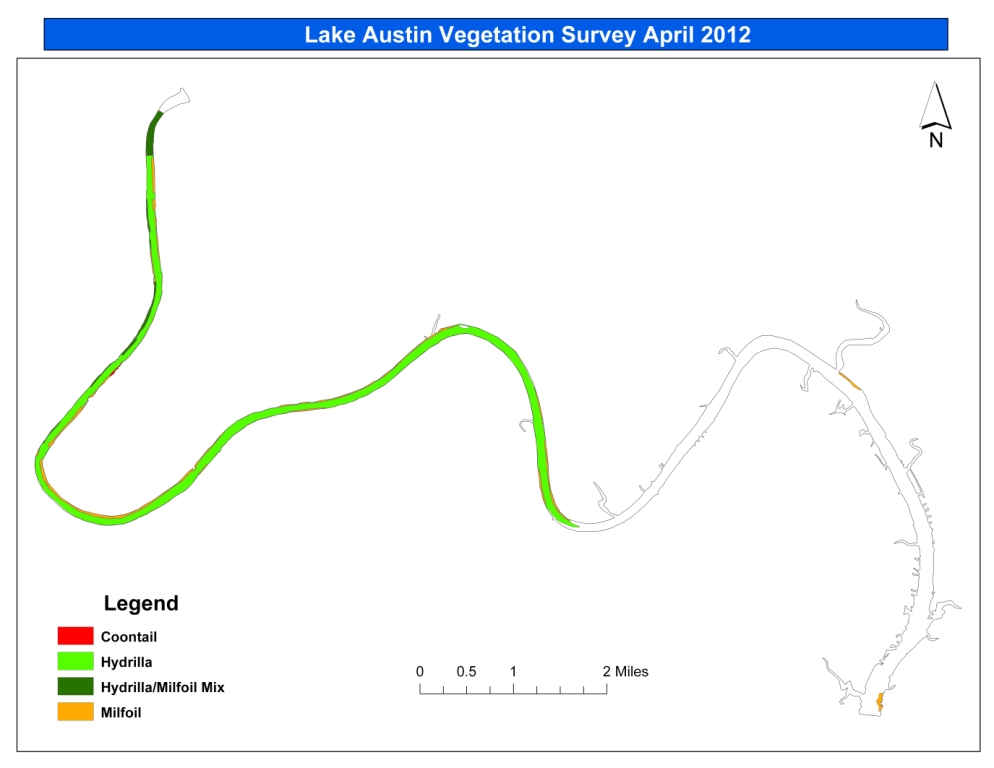
The increase is most likely due to the drought-induced low water levels on Lake Travis, making the deep water releases into Lake Austin warmer than normal. Hydrilla has been increasing steadily over the past year, and has now reached levels that can limit shoreline access as well as other lake activities. This trend is expected to continue, especially since LCRA is not releasing water for rice irrigation in 2012, so there is limited water flow through the lake.

The graph above shows plant growth and fish stocking over time.
From 2003-2011, more than 30,000 fish were stocked in the lake (20,000 purchased by COA, 10,000 by TPWD), and for over five years, the fish were effective in keeping hydrilla below nuisance levels. With the recent surge in hydrilla growth, TPWD approved an additional 15,200 grass carp, and the cost of these fish will be shared by the COA, LCRA and Friends of Lake Austin. It is hoped that this large input of fish will provide a significant level of control, as the plants continue to grow and threaten uses of the lake.
Hydrilla sprouts new plants from fragments containing at least one circle of leaves, or leaf whorl. Once hydrilla becomes established, it is easily spread by waterfowl and boating activities.
Hydrilla forms dense mats of vegetation that can interfere with recreation and degrade fish and wildlife habitat. Hydrilla can grow extremely rapidly, up to one inch per day, until it reaches the water's surface and forms a thick mat that effectively shades any plants below it. Plants have been known to reach a length of 50 feet and produce a biomass of more than 130 tons per acre.
Does hydrilla provide good habitat for fish? Initially, yes. Aquatic plants are an important part of Lake Austin's environment, providing habitat and food for organisms living there. Before it gets too dense, hydrilla can provide good habitat for fish. However, fish populations are negatively affected when hydrilla exceeds 30-40% coverage of the lake. Hydrilla will grow with less light and fewer nutrients than other aquatic plants, and can outcompete all other native and non-native plants. Eventually, decomposing plants can rob the water of oxygen needed for fish and a healthy aquatic community.
- To minimize fragmentation and spreading of plants, avoid boating through dense hydrilla mats.
- Remove hydrilla from your boat's propeller and trailer before and after boating.
- Dispose of all plant fragments on shore: Because new plants can sprout from fragments, all plant material cut or collected MUST be removed from the lake. Throwing hydrilla back in the lake can result in a maximum fine of $2000 per plant.
- Follow City of Austin hydrilla disposal guidelines:
- Plants should be placed as far up on the shore as possible.
- Plant material stockpiled within 75' of the water's edge should be surrounded on the downslope side by silt fencing.
- Plant material pulled from the lake will contain small fish and other organisms, and will have an odor associated with it. The plants are mostly water, and piles will lose 90% of their bulk within 2-4 weeks. This material can be used to mulch flowerbeds or gardens.
- Learn more about Friends of Lake Austin (FOLA) - a citizen group dedicated to preserving and enhancing Lake Austin for those who live, work and play on the lake. They have been working to help fight the hydrilla infestation on Lake Austin and are taking an active role in the approved management plan
In 2000, COA, TPWD, LCRA and Friends of Lake Austin finalized the Lake Austin Hydrilla management plan that integrates all control efforts appropriate for use in this situation. Objectives are to return Lake Austin to a pre-hydrilla condition and to maintain a healthy lake ecosystem and fishery. It integrates every appropriate control option, so that potential impacts from any one option are minimized while the possibility of success is increased.
Sterile grass carp have proven the most effective control, because they can move throughout the lake, eating plants in any water depth. Biennial winter drawdowns provide additional relief, but only in less than 12 ft of water. From 2003 to 2011, over 30,000 grass carp were stocked, and hydrilla remained below 65 acres until late 2009, when drought-induced warmer water temperatures provided an advantage to the plants.
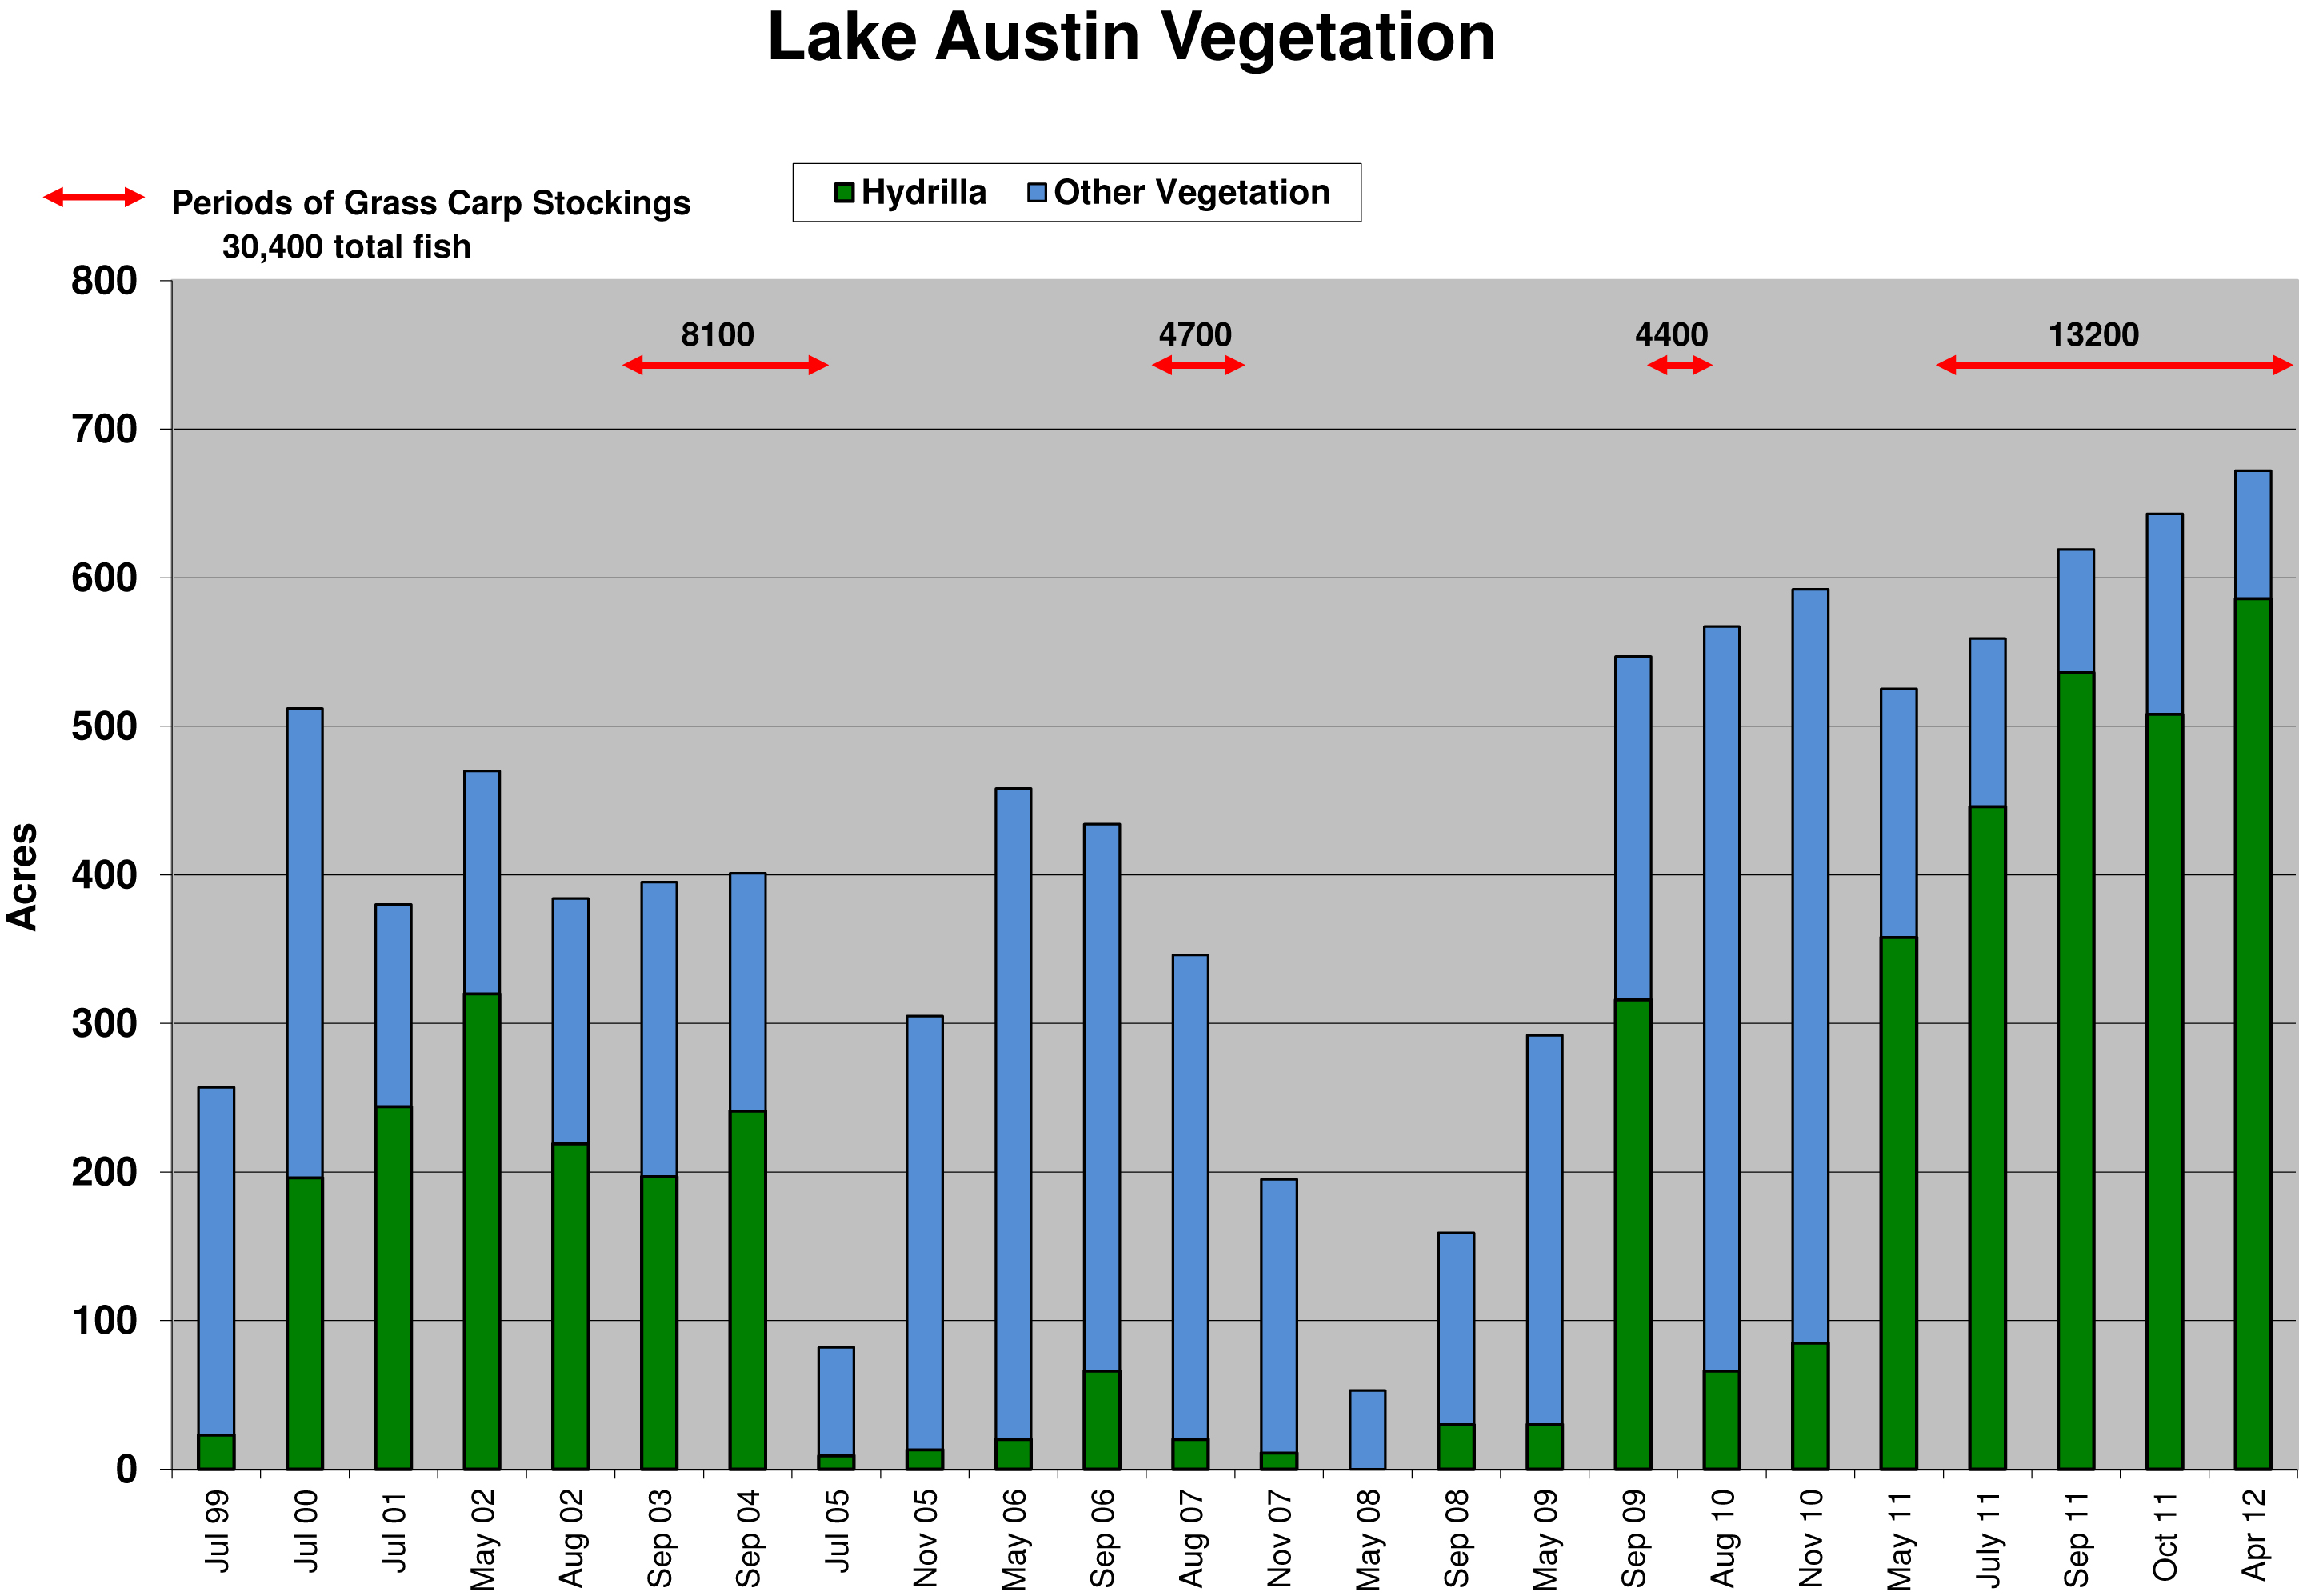
The graph above shows plant growth and fish stocking over time.
As of April 2012, aquatic vegetation (586 acres hydrilla, 86 acres Eurasian watermilfoil, and a mix of other plants) covered 41% of Lake Austin. Because of its dense and rapid growth, hydrilla has the potential to impact virtually every one of Lake Austin's uses:
- Intakes for drinking water, power generation and irrigation can be clogged
- Shoreline access and boating traffic can be restricted
- Swimmers can get tangled in its thick growth
- Water quality may degrade as dense vegetation dies and decomposes
- Plant and animal diversity will decline as hydrilla takes over
- Property values can decrease as recreation is limited by dense plant growth
- Hydrilla may spread downstream to Town Lake and the lower Colorado River.
Hydrofiles
Contact Sara Heilman, email or phone 512-974-3540. Allow at least 2 hours for field trips (caving and creek testing). Bus fees will be reimbursed.
Contact Sara Heilman email or phone 512-974-3540. Our training kit contains 6 sets of the following kits: Dissolved oxygen, pH, TDS, nitrate, and E. coli. The kit may be checked out and we provide training for your students if required. You may also request one free complete test kit.
Water test kits are available for teachers and classes for educational use. General use kits may be requested through Keep Austin Beautiful
Contact Sara Heilman for specific information about your school's watershed, maps and curriculum on non-point source pollution and land use.
Part 1 View the presentation, then illustrate your concept of point source and non point source pollution
Part 2 Use the information on the site Protecting Water to answer the questions on the student sheet.
Part 3 A. Spills data
Follow directions on the student sheet and answer questions 1-6
B. Contour maps Permitted business data Use the contour map of your watershed, 2000 land use map of your watershed, and the data to answer questions 7-8.
Part 4 Use information from the Watershed Viewer Follow directions on student sheet and answer questions 11-16.
Land use and Water Quality in your Watershed
Goal Students learn how land use affects water quality.
Objective Students will:
- Define watershed;
- Identify land use and water quality impacts;
- Research and identify pollutants associated with particular types of land use found in their watershed.
Time Two to three, 45 minute class periods (may need another class period to finish research)
Science TEKS Biology 2(A, C, D) Environmental Systems 2(A,C,D); 4(C); 5(A,B,F); 8(A,D) Aquatic Science 2(A,D,E); 3(B,D); 5(D); 8(A,B,C); 10(C)
Student Vocabulary
Watershed - An an area of land that drains water into a particular creek, river, lake, or aquifer. Water drains downhill, so hills, ridges and other high points define the boundaries of a watershed.
Land Use - the human activity or economic function associated with a specific piece of land; the way the land is used in a watershed (e.g. residential, industrial).
Headwaters - the source of a creek or where the creek begins.
Mouth - the point where a creek enters a larger body of water.
Runoff - water that flows over the surface of the land into a creek, river, or lake; may carry a variety of pollutants.
Pervious Surface - a land surface such as grass or soil which allows water to filter through the ground.
Impervious Surface - a land surface such as a road, parking lot, sidewalk, rooftop, or other surface that does not allow water to filter through.
Point Source - a single identifiable source that discharges pollutants into the environment (e.g. sewer, ditch, pipe).
Non-point Source Pollution - pollution that cannot be traced to a single point because it comes from many individual sources or a widespread area.
Lesson 1-Part I: Land Use and Flow Paths in Your Watershed
Materials Some materials are in PDF format and require Adobe Acrobat Reader for viewing
- Watershed model
- Student Handout #1: Land Use and Pollutants: Causes and Effects
- 1990 and 2000 Land Use maps of your watershed
- Anderson High School (Bull Creek Watershed)
- Austin High School (Lady Bird Lake)
- Barton Creek Watershed
- Bowie High School (Slaughter Creek Watershed)
- Crockett High School (Williamson Creek Watershed)
- Garza High School (Boggy Creek Watershed)
- Hyde Park Baptist Church (Waller Creek Watershed)
- Lanier High School (Little Walnut Creek Watershed)
- McCallum High School (Shoal Creek Watershed)
- Reagan High School (Fort Branch Watershed)
- Travis High School (Blunn Creek Watershed)
- Westlake High School (Eanes Creek Watershed)
- Student Activity Worksheet-Lesson 1:
- Map transparency
- Bull Creek Watershed Transparency Map
- Barton Creek Watershed Transparency Map
- Slaughter Creek Watershed Transparency Map
- Williamson Creek Transparency Map
- Boggy Creek Watershed Transparency Map
- Little Walnut Creek Watershed Transparency Map
- Blunn Creek Watershed Transparency Map
- Eanes Creek Watershed Transparency Map
Preparation
- Call 974-2550, to arrange for a watershed model.
- Copy Student Handout #1. Land Use and Pollutants: Causes and Effects for each student
- Copies of 1990 and 2000 Land Use maps for each student group (above).
- Copies of Student Worksheet-Lesson 1: Land Use and Water Quality in your watershed (for each student)
Facilitating the Activity
- Define a watershed- A watershed is an area of land that drains water into a particular creek, river, lake, or aquifer. Water drains downhill, so hills, ridges and other high points define the boundaries of a watershed. The water that flows over the surface of the land and drains into a body of water is called runoff. The cleaner the land (i.e. watershed) the cleaner the runoff and the receiving body of water. If the land (i.e. watershed) is polluted, then runoff is polluted and the receiving body of water becomes polluted.
- Do Watershed Model demonstration- Allow students to rain on the watershed using the watering can. Focus on the downhill pathways the water follows to drain to the creek, and the cleanliness of the water as it flows over the land. Tell students the red food coloring represents pollution. Allow students to drop one drop of food coloring on different areas of the watershed. Rain again and discuss the flow of pollutants from the land (i.e. watershed) to the creek.
- Define Land Use- Land Use is how land has been changed for human use, e.g. for a school, road, park, preserve, etc. Studying land use is a quick, practical method of locating the source of pollutants found within a watershed. Watershed scientists are particularly interested in studying land use to determine the impact it will have on water quality. The first step in assessing land usage in a watershed is to observe how the land surrounding the waterway is being used. Different types of land use generate different types of pollutants, which can runoff into the local body of water. Land use practices in the Austin area can affect the quality of our creeks and ground water in various ways that you will research and identify.
- Identify Land Use Impacts to Water Quality- Discuss student handout #1 Land Use and Pollutants:Causes and Effects. Students will use this handout to answer questions on the student sheet.
- Student Land Use Map Activity- Arrange students in groups and give each group 1990 and 2000 Land Use maps of their watershed. Show transparency of 2000 map. Locate and define the headwaters, mouth, and the different kinds of land use. Give groups time to complete Lesson #1: Land Use and Water Quality In Your Watershed.
Lesson 2: Point and Non-Point Source Pollution
MaterialsSome materials are in PDF format and require Adobe Acrobat Reader for viewing
- Powerpoint slide show
- Excel files-“Spills In Your Watershed”
- 2000 Land Use Map of your watershed
-
Contour Map of your watershed
- Anderson High School (Bull Creek Watershed)
- Austin High School (Lady Bird Lake)
- Barton Creek Watershed
- Bowie High School (Slaughter Creek Watershed)
- Crockett High School (Williamson Creek Watershed)
- Garza High School (Boggy Creek Watershed)
- Hyde Park Baptist Church (Waller Creek Watershed)
- Lanier High School (Little Walnut Creek Watershed)
- Travis High School (Blunn Creek Watershed)
- Student activity worksheet Lesson 2
-
Student Handout #2: Pollution Permitted Facilities (Excel Files)
- Anderson High School (Bull Creek Watershed)
- Barton Creek Watershed
- Bowie High School (Slaughter Creek Watershed)
- Crockett High School (Williamson Creek Watershed)
- Garza High School (Boggy Creek Watershed)
- Lanier High School (Little Walnut Creek Watershed)
- Travis High School (Blunn Creek Watershed)
- Student Links
Preparation
- Arrange computer (internet) access for each group or produce hard copies of the websites.
- Copy Lesson 2 for each student.(above)
Facilitating the Activity
- Introduce point and non-point source pollution - There are two types of pollutant sources that enter waterways, point and non point sources. Point source pollution is a single identifiable source that discharges pollutants at specific locations through pipes, ditches or sewers into bodies of water. Typical point sources of pollution include industrial waste discharge, sewage plants, chemical spills, oil spills, illegal dumping, and construction sites where 5 or more acres are disturbed. Typically, this type of pollution results from the wastes or by products of public and private commercial facilities, which are purposely deposited into the water. Because point sources are at specific sites, they are fairly easy to identify, monitor and regulate. In the City of Austin, point sources of pollution include businesses that require a permit to discharge their chemicals (Stormwater Discharge Permit Program), and documented spills (Spills and Complaints Response Program). The City of Austin’s Stormwater Discharge Permit Program conducts inspections of specific commercial and industrial operations to ensure compliance with a City Code that protects water quality. Inspectors check materials handling, waste storage, and disposal practices from these businesses. These wastes must be disposed of properly, not on the ground or to a storm drain or waterway. The Spills and Complaints Response Program conducts investigations, assesses the potential environmental impact, determines the responsible party, identifies the pollutant, achieves compliance with environmental regulations, and ensures that corrective actions and preventative measures are taken. Non point sources of pollution are scattered, diffuse sources of pollution that cannot be traced to any single point of discharge. Non point sources can be hypothesized by observing the land use surrounding the water source. Generally, non point source pollution is created through everyday occurrences in places where there is an increase in impervious surfaces and human activity. Examples include: lawn care chemicals, household hazardous products such as paint, petroleum products from cars and lawn mowers, and bacteria and nutrients from pet waste. When rain falls, these substances mix into storm water and eventually make their way into creeks, rivers, and lakes. The concentration of non point source pollution may be enough to degrade water quality and impact aquatic organisms and human health.
- PowerPoint Presentation - Present slide show OR allow students to view it on their own using computers. Give each student a copy of the student activity worksheet, Lesson 2-Part 1: “PowerPoint Presentation” to fill out after the presentation.
- Student Group Activity Two- Arrange student groups for use on computers with Excel and internet access. Give each student the handout Lesson 2-Part 2: "Point and non point pollution in your watershed”. Instruct students to use links on the Student Page for “Spills In Your Watershed”, Contour Map, and Student Handout #2: “Pollution Permitted Facilities”, and the 2000 land use maps from lesson 1.
Note: If your students have a question about a spill in their watershed or you are interested in having a spill investigator give a presentation to your class, contact Eric Kaufman at 974-3512
If your high school is not listed here and you would like this lesson adapted for your watershed, please contact Sara Heilman at 974-3540
Map of Austin's Watersheds with High Schools
Integrated Pest Management, Integrated Pest Management
GROW GREEN FACT SHEETS are available to download or you can also pick hard copies from many sites around Austin that distribute Grow Green materials.
Other Common Pests and Grow Green Recommendations
The landscape problems listed below occur in Austin but we do not have the same demand for information about them as the pests that have GROW GREEN FACT SHEETS.
Bacterial Leaf Spot
Problem
Leaves yellow and may drop. Plants lose vigor and produce less chlorophyll. Bacterial Leaf Spot is caused by wet plant foliage and injury. This is commonly seen on:
Greens
Turnips
Cauliflower
Cabbage
English Ivy
Tomatoes
Fruit trees
Several ornamental shrubs and trees
Least Toxic Solutions
- Avoid wetting foliage when watering.
- Space plants to allow adequate air flow.
- Do not injure foliage. Bacteria enter plants through wounds or natural openings.
- Remove infected plant sections.
- Carefully consider use of chemical controls— they are often only marginally effective.
- If you must use a chemical control, apply a copper hydroxide product such as Kocide®.
Cotton Rot/Root Rot
Description: Fungal plant disease that attacks the roots of plants, turning them brown rather than a healthy white. Cotton root rot is common in soils with a pH over 7.2 and in areas with high summer temperatures. Problem: Plants wilt, dieback and lose vigor. Control is difficult because symptoms normally appear after damage to the stem or root is severe. Cotton Root Rot moves through the soil from plant to plant, with symptoms usually occurring in July and August.
Attacks: More than 2,000 species of plants including:
Cotton
Ornamentals
Fruit trees
Nut trees
Shade trees
Most landscape plants
Least Toxic Solutions
Cotton Root Rot
No treatment available once plant is infected. Mulch plants to keep soil cool. Add organic material to clay soils. Use resistant plants, natives and grasses. When practical, acidify soil in the root zone of the plant.
Root Rot
Ensure proper drainage and allow excessively wet soils to dry. Plant in raised beds if drainage is marginal. Avoid crowding plants in beds. Place plants at the same soil depth as they were in the container you purchased them in. Because there are several different fungi that cause root rots, have the disease diagnosed at the Texas A & M Plant Disease Lab or by Extension personnel before applying fungicide.
Fire Blight
Description: Bacterial disease that causes rapid blackening and desiccation of blooms and foliage. Affected shoots bend at the tip in a "shepherd's hook". Black, sunken twig and branch cankers develop later. Problem: Fire Blight causes twig dieback and blossom blight in up to 2-24 inches of twig length. The bacterium stays in the cankers over winter and in the spring, oozes from the cankers and is carried by wind, rain and insects to healthy foliage.
Attacks:
Pears
Apples
Pyracantha
Quince
Loquat
Indian Hawthorne
Photinia
Least Toxic Solutions
Avoid high nitrogen levels and excessive pruning. Vigorous growth is much more susceptible to fire blight. Prune four inches below visible cankers. pruning equipment between cuts with one part household bleach to nine parts of water. Clean and oil equipment after pruning. Select fire blight resistant varieties and species. Contact the Extension office at 854-9600 for a list. With the exception of Kocide® and streptomycin sulfate, chemical controls are usually ineffective.
Oak Wilt
Description
Fungus that plug water-conducting vessels, reducing flow of water up the stem of the tree. Often causes leaves to wilt and fall prematurely. Live Oaks: Tree appears weakened. One area of the tree dies at a time. Areas around leaf veins are often brightly colored.
Red Oaks: Die in a flash of fall color in early summer.
Problem
Disease spread by beetles feeding on tree wounds. Also can travel from tree to tree through interconnected roots. Oak Wilt travels 75 feet per year in all directions. Live Oaks die quickly one tree at a time.
Attacks
- Blackjack Oak
- Live Oaks
- Schumard Oak
- Spanish Oak/Texas Red Oak
Least Toxic Solutions:
- Prune oak trees only in the coldest part of winter and hottest part of summer.
- Use a pruning paint to protect cut or wounded areas immediately after pruning or wounds are discovered. Sterilize tools after pruning.
- Contact Chris Dolan, City of Austin Oak Wilt Suppression Program at 512-974-1881 for information.
- Trench 4' deep and at least 100 feet from infected and susceptible trees to sever root connections.
- Only use old, dry wood if you use oak firewood.
- Certified applicators can inject ALAMO® into tree roots. This method is best used as a preventative.
Thrips
Description
Description To the naked eye, they look like tiny threads; with a hand lens, their narrow, fringed wings are visible. When holding an infested rose bloom you can see that they are very active. They may even bite!
Infestation
Tattered flowers, deformed flowers, silvery spots or streaks on leaves - by the time damage is visible the infestation is already severe.
Attacks:
- Roses
- Daylilies
- Iris
- other flowers
Lifecycle
Adults lay hundreds of eggs in plant tissue. In Roses, the eggs hatch inside the flower bud. The resulting nymphs scrap plant tissue, then, suck the sap, damaging the flower before it opens. There are many generations per year.
Least Toxic Solutions: Thrips are notoriously very difficult to control, so early detection is important when trying to keep the populations in check.
Aim for control rather than eradication. The only way to completely get rid of thrips is to destroy the infested plants - not an option most want to consider
- Remove and dispose of infested blooms
- Clean up leaf litter
- Always read and follow pesticide labels
-
Alternate the following treatments:
- Spray with Neem oil. For best results the spray needs to come in contact with the insect, but Neem oil is also slightly systemic; meaning some of it will absorb into the plant tissue and help weaken the insect after it feeds on the plant
- Dust plants and immediate area with diatomaceous earth Use a light weight horticultural oil
Viruses
Description
Sub-microscopic infectious particles that multiply only inside living cells. Viruses enter plants through wounds and by insects that feed on plants. Symptoms vary but include abnormal color, vein patterns, shape, mottling, ring spots and mosaic patterns in leaves; Can include abnormal flower color and fruit size, shape and color.
Problem
Seldom lethal to plants, but severely affect the quantity, quality and longevity of the host plant.
Attacks
Many types of plants.
Least Toxic Solutions:
- Chemicals do not effectively control virus diseases.
- Select plant stock that is free of viruses.
- Cover susceptible annual garden plants with a row cover fabric to keep sucking insects away from healthy plants.
- Diseased plants should be removed and destroyed to prevent infection of other plants by sucking insects that move from plant to plant.
Additional Links
Integrated Pest Management
Learn more earth-wise gardening tips at www.GrowGreen.org
In 1990, the City authorized this program to review and regulate City pest control activities.
The IPM program has the following responsibilities:
- Proved guidance to City of Austin departments and programs in pest management issues
- Review IPM plans when they are required in the land development review process
- Assist implementations of IPM agreements between the City and specific private local golf course
- Educate the citizen's of Austin regarding least-toxic pest management and IPM
- Save Our Springs (SOS) water quality initiative
- National Pollution Discharge Elimination System (NPDES)
- Submit a Plan
- Stormwater Facilities IPM requirements
Developers
If an IPM plan is required, developers should be informed during the development review process. It is then their responsibility to submit, and comply with, a plan. If the land is then sold, it is their responsibility to communicate the need for the new land owner to abide by the plan.
Homeowners
If you own an individual parcel of land that requires a site plan review and no developer or previous owner has submitted an IPM plan, then it is your responsibility to do so.
If you purchase a property that already has a plan, then it is your responsibility to abide by the plan.
The Save Our Springs Ordinance (SOS) was adopted in 1992 and differed from its predecessors because it became law by citizen initiative. Two ordinances worth noting preceded the SOS Ordinance: the Interim and Composite Ordinances. These ordinances addressed development in the Barton Springs Zone, which includes Barton Creek and the other creeks draining to, or crossing, the Edwards Aquifer recharge zone. Highlights of these ordinances included: the first requirements for non-degradation (based on stormwater discharge concentrations) and provisions that excluded variances unless a demonstrable improvement in water quality was shown. Variances, which made departures from an ordinance permissible, were a general feature of watershed ordinances up until this time.
The SOS Ordinance, applied throughout the Barton Springs Zone, required: non- degradation (based on total average annual loading), and lowered impervious cover to 15 percent NSA for all development in the recharge zone, 20 percent NSA for development in the Barton Creek portion of the contributing zone and 25 percent NSA for development in the remaining portions of the contributing zone in Williamson, Slaughter, Bear, Little Bear and Onion Creeks.
- Weed & Feed
- Big 3
- Grow Green Landscape Professional Training
IPM Plans for Water Quality Protection are required when one or more of the following conditions exist:
Regulatory
- When land is developed in the Barton Springs Zone (required since 1992 under the Save Our Springs, SOS, Ordinance); homes and businesses built before the ordinance are grandfathered and do not require IPM plans although voluntary compliance is encouraged
- When a City Board or the City Council requires an IPM plan (usually occurs when a developer request a variance from regulations)
- When the requirement is written into an agreement, such as for a PUD or to qualify for Green Building certification credits
-
Per the Environmental Criteria Manual (ECM), when specific water quality treatment systems are used on commercial properties, including:
- Wet ponds (1.6.6)
- Retention/Irrigation (1.6.7.A)
- Vegetative filter strips (1.6.7.B)
- Biofiltration (1.6.7.C)
- Rainwater harvesting (1.6.7.D) if used in conjunction with vegetation
- Disconnection of Impervious Cover to Vegetated Filter Strip (1.6.7.F)
- Non-required vegetation (1.6.7.G)
- Rain gardens (1.6.7.H)
- On intensive landscape management sites such as athletic fields and golf courses. These require customized IPM plans because the anticipated pests are more likely to be specialized
Developers
If an IPM plan is required, developers should be informed during the development review process. It is then their responsibility to submit, and comply with, a plan. If the land is then sold, it is their responsibility to communicate the need for the new land owner to abide by the plan.
Homeowners
If you own an individual parcel of land that requires a site plan review and no developer or previous owner has submitted an IPM plan, then it is your responsibility to do so. If you purchase a property that already has a plan, then it is your responsibility to abide by the plan.
Jollyville Salamander
Jollyville Plateau salamanders are currently listed as threatened under the Endangered Species Act as of September 2013. Populations have declined in urbanized watersheds but remain stable in undisturbed portions of their range.
The ideal habitats for the Jollyville Plateau Salamander are springs, spring-fed streams, and caves with flowing water. Most of the known populations are surface dwelling, or epigean, although this can be somewhat of a misleading classification because the salamanders will retreat to underground refugia during dry periods when the springs no longer flow at the surface.
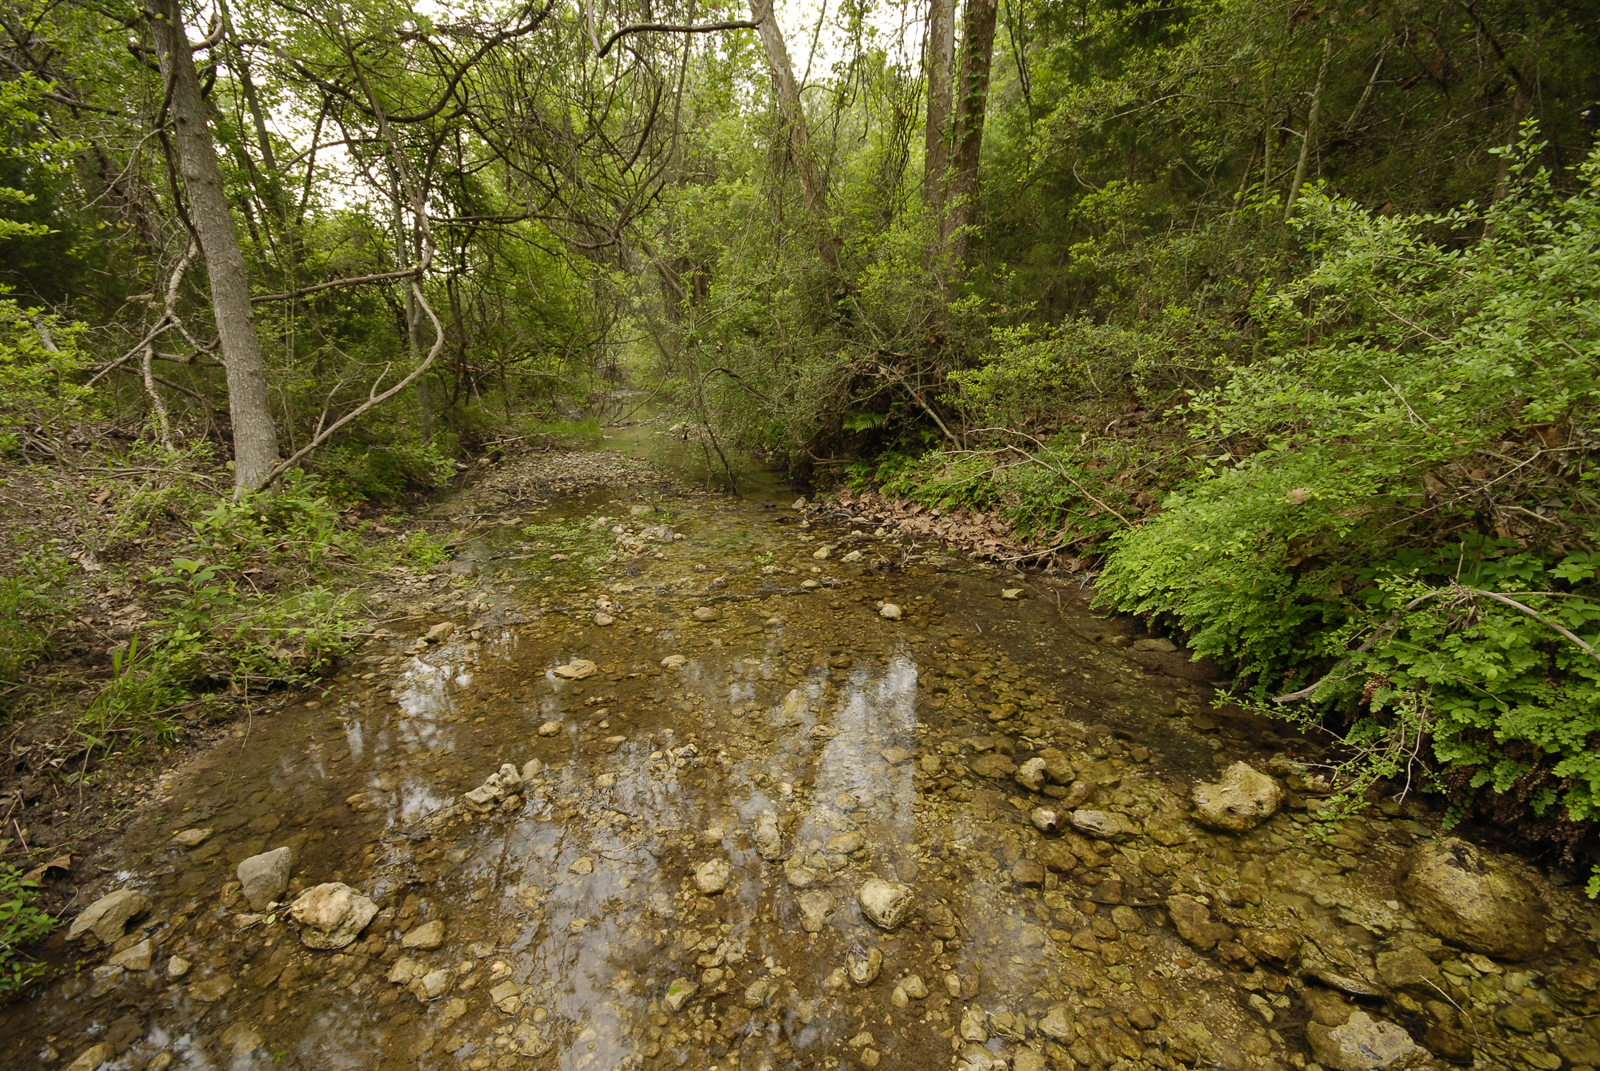
There also are at least a half dozen caves in the Buttercup Cave system inhabited by salamanders. These salamanders are called troglobites because they spend their entire lives underground (although many may be able to survive on the surface, in which case they would be considered troglophiles). It is unclear whether all cave populations are more closely related to each other than to surface populations, but it is clear that there is variation in morphological appearance among the different populations of cave-dwelling E. tonkawae. Researchers currently are examining the population genetics of this species, which will give more insight into the relationships among the cave and surface populations.
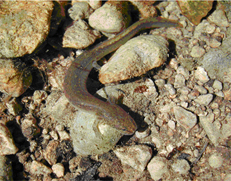
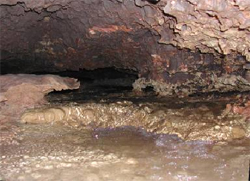
This is a picture of the cross-section of a stream bed when there is no surface flow and the water table has retreated to a sub-surface level. The salamanders retreat with the water level and live under the stream bed until the stream begins to flow again. Down there, they can move between the interstitial spaces created by larger stones below the surface of the stream, as shown in this picture.
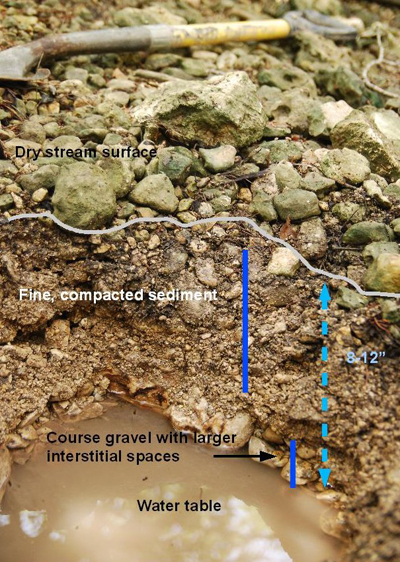
The City of Austin initiated an intensive two-year study in 1997 and 1998 to collect baseline information about the JPS. This effort established nine monitoring sites in three watersheds (Bull, Long Hollow, and Shoal) where transects were searched periodically and all salamander observations were recorded (direct count survey). From 1999 to 2003, City of Austin biologists continued to conduct direct count surveys at some of these original monitoring sites, but on a less frequent basis. Beginning in 2004, City of Austin biologists expanded monitoring efforts to include all nine long-term monitoring sites as well as new sites in other watersheds (Cypress, Walnut, and West Bull). The purpose of these surveys was to assess trends in relative abundance, habitat conditions, and seasonal variation in reproduction.
Recent efforts to understand the population dynamics of Jollyville Plateau salamanders began in response to the City’s plan to build a water treatment plant (WTP4) at the headwaters of Bull Creek, an ecologically-sensitive area and home to many large populations of salamanders. This included a mark-recapture survey that tagged salamanders so they could be studied at three different sites to compare the effects of the proposed water treatment plant before and after construction. In the past, all monitoring was conducted by periodically counting all salamanders observed in a given area. However, this method did not take into consideration capture probability (the likelihood of capturing an animal that is present), which can have a large effect on estimated population size. Mark-recapture allows for estimation of capture probability, and thus, much more accurate approximations of population size in addition to estimates of survival and migration.
In December 2007, the City Council voted to purchase an alternate site to move WTP4 out of the Bull Creek watershed. However, the mark-recapture portion of the study is still ongoing, although with less frequent sampling.
Landscape Professional Training
“My whole business modeling is changing and Grow Green added fuel to that change”.
“I expect to use more rain gardens and bioswales and continue to promote better soils to improve water availability to plants.”
“Although much of this was review, it was really helpful to listen to the best experts in Austin, and learn more about the City ordinances affecting design”.
“Great program. Love it, will return next year. Thank you so much”.
“Very well-organized, and the speakers all presented very actionable information”.
January 23, 2013
The presentations and handouts listed here were used as a part of the 2013 Grow Green Landscape Professional Training series and reflect the opinions of individual presenters.
Nora Mullarkey - Water Use and Conservation
Dan Pedersen - Water Reclamation in Austin
Sasha Earl - Rainwater Harvesting
Peter Varga - Water Conservation Code Revisions and Watering Variances
Susan Hoover - Water Budgeting / Irrigation Techniques
Jody Slagle - Dillo Dirt
January 30, 2013
Wizzie Brown - Ants: ID & Management
Ana Gonzalez & Lara Schuman - Tree Care
Daphne Richards - Plant Nomenclature & Physiology
Erin Cord - Attracting Wildlife
Liz McVeety - Least Toxic Solutions to Most Common Pest Problems
February 6, 2013
Glee Ingram - Applied Sustainable Landscaping: A Case Study
Susan Kenzle - Rain Gardens
Erin Wood - Commercial Landscape Ordinance
February 13, 2013
Jim Linardos - General Fire Behavior
Josh Portie - Firewise
Michael Embesi - Site Considerations, Tree Ordinance
Chris Harper - Considerations: Protected Species and Protected Property (habits)
Rich Gray - Development and Implementation of Fuels Reduction Projects
“Great opportunity to keep up-to-date with new ideas and regulations in a nice atmosphere surrounded by people who want to support our area’s environment.”
“Hearing extremely knowledgeable people discuss how and why they do things gives me a better base from which to work with other professionals whose fields abut or slightly overlap mine.”
“There is always something I get from the training that changes how I teach my clients to maintain their space, whether its pest management, pruning or plant selection.”
“I will definitely be continuing to educate the public on wildfire. This course helped me see how to effectively share this information.” “All speakers well immersed in the content and are open to collaboration and the bigger picture. Excellent in all regards.”
July 16, 2014
The presentations and handouts listed here were used as a part of the 2013 Grow Green Landscape Professional Training series and reflect the opinions of individual presenters.
Michael Embesi
Navigating Tree Regulations
Lara Schuman
Caring for Mature Trees Navigating Tree Regulations
Andrea DeLong-Amaya
Native Plants for Texas Landscapes
Paige Oliverio & Mitch Wright
Permaculture - The New Culture of Food & Urbanity
Keith Brown
Common Tree Pests & Solutions
July 23, 2014
Dr. David Villarreal, Texas Department of Agriculture
For questions about Environmental Issues with Use of Landscape Chemicals contact: David.Villarreal@TexasAgriculture.gov
Texas Department of Agriculture Pesticide Program
Wizzie Brown
Fire Ant Management
Perry Cervantes, Texas Department of Agriculture
For questions about Pesticide Laws and Regulations contact: Perry.Cervantes@TexasAgriculture.gov
Texas Department of Agriculture Pesticide Program
Mike Kelly & Darcy Nuffer
Managing Expectations for Large Constructions Projects
Matt Hollon
Landscape & Watershed Ordinance Updates
Atha Phillips
An Easy Guide to Passing Landscape Inspections
July 30, 2014
Meredith Gray & Chris Sanchez
Vegetable Gardening, Wicking Beds, and Hugelkultur
Zach Herigodt
Edible Landscaping
Jane Tillman
Designing Landscapes for Life
Tom Franke
Green Alleys and Rain Gardens
Daphne Richards
Personal Protective Equipment
August 6, 2014
Jody Slagle
The Magic of Composting
Fred Phillips
Restoring the Colorado River and Its Delta, Lessons Learned
William Glenn
The Soil Sponge: Compost
Mark Jordan
Drought & Utility Update
Markus Hogue
Water Conservation Through Irrigation Technology
John Abbott
Jacob Johnson
Chris Charles
Austin Water Rebates
August 13, 2014
Will Boettner
Know Your Role
Justice Jones
From at Risk to Empowered
Ryan Hebrink
Environmentally Minded Mitigation
Michael Embesi
Mitigating to Preserve High Value Trees
Glen Gillman
Wildland Fire Behaving Badly
Daphne Richards
Added Value Landscaping
August 25, 2015
Know Your Role - Know Your Role
Will Boettner, Texas A&M Forest Service
Virtual Assessments
Virtual Assessment 1
Virtual Assessment 2
Virtual Assessment 3
Virtual Assessment 4
Environmentally-Minded Mitigation - Environmental BMPS for Firewise Landscaping
Ryan Hebrink, Watershed Protection
Mitigating to Preserve High-Value Trees - Mitigating to Preserve High-Value Trees
Michael Embesi, City of Austin Arborist
Wildland Fire: The Good, The Bad, and the Ugly - Wildland Fire: The Good, The Bad, and the Ugly
Lucien Ball, Austin Water Utility
Fire Effects on Native Landscaping - Fire Effects on Native Landscaping
Michelle Bertelsen, Lady Bird Johnson Wildflower Center
Landscaping for Wildlife in the Wildland Urban Interface - Landscaping for Wildlife in the Wildland Urban Interface
Meredith Gray, Parks and Recreation
July 21, 2015
Water Conservation: Drought Update
Drema Gross - Water Conservation Division Manager, Austin Water
Gray Water: Navigating Through City Code
Robert Stefani - Conservation Program Specialist, Austin Water
Gray Water: Projects and Irrigation Connections
Chris Maxwell-Gaines, P.E. - Innovative Water Solutions, LLC
Reclaimed water: Using Bulk Fill Stations
Bill Kemp - Caracara Farm
Design: Earthworks and Landscape Design for Water Conservation
Betty Lambright - As Right As Rain
Soil: Contractor Use of Soils
Jared Pyka - ValleyCrest
Water Conservation: Water Conservation Landscape Programs
Chris Charles - Water Conservation Associate Austin Water
June 23, 2015
Creekside Landscaping - Riparian Restoration
Ana Gonzalez, Watershed Protection Department
Green Infrastructure Working Group - Integrate Nature Into the City
Erin Wood - Watershed Protection Department
So You want to Build A Rain Garden - So You Want to Build a Rain Garden
Tom Franke, EIT & Michelle Adlong, Watershed Protection Department
Turf Problems and IPM - Lawn Problems an integrated pest management approach
Daphne Richards, County Extension Agent—Horticulture Texas A&M AgriLife Extension Service
Ants: Identification, Biology and Management - Ants: Identification & Management
Wizzie Brown - Texas A&M AgriLife Extension Service
Mosquitos - Integrated Mosquito Management (IMM)
Sabrina V idaurri, MS, RS, City of Austin/Travis County Health Department
March 24, 2015
Plants Running Hot & Cold - Plants Running Cold, Hot & Dry
Denise Delaney, City of Austin Watershed Protection
Austin’s Tree Regulations - Austin's Tree Regulations
Michael Embesi, PDRD Tree Program
Landscaping with Trees for Water Conservation - Designing for Trees for Drought
Vincent Debrock
Native Plant Combos - Native Plants for Texas Landscapes
Andrea DeLong-Amaya, Lady Bird Johnson Wildflower Center
Professional Pruning - Professional Prunning
Laura Schuman, Parks & Recreation Department
Plants for Rain Gardens & Bioswales - Plants for Biofiltration Systems
Elizabeth McGreevy, Roc + Solid Land Design
Feb 24, 2015
Big Picture Local Food System - Austin's Sustainable Food System is a Local One
Edwin Marty
Alternative Ways to Water - Alternative Gardening and Watering Methods
Meredith Gray, City of Austin Parks and Recreation Department
Chris Sanchez, City of Austin Parks and Recreation Department
Rainwater Harvesting - Rainwater Harvesting for Grow Green Professionals
Dick Peterson
Sustainable Landscaping with Tough Herbs - Sustainable Landscaping with Tough Herbs Colleen
Dieter, Red Wheelbarrow
Landscaping for Wildlife - Landscaping for Wildlife
LaJuan D. Tucker, City of Austin Parks and Recreation Department
Sustainability
"Many of the conservation techniques/practices will be applicable"
"Knowledge of the presenters, and enough time available for in-depth treatment of topics."
"Diverse speakers, great information, great atmosphere and attitudes"
Plants
"The best thing about today’s training was the variety of speakers and material presented was very practical…can implement in the field immediately".
"The tree pruning information was highly informational"
Water Quality and Integrated Pest Management
"I love rain gardens! I learned a lot of new information on different designs, testing soil, infiltration and filtration"
"Plan to apply ant identification, rain gardens, bio media information and encouraging creekside wilding"
Water Conservation
"I love how you start with information on drought updates and city codes then beef up (or tofu) the subject!"
"I always learn a lot from these trainings. I liked that most everything flows well and is on time."
Firewise
"My organization is concerned with risk. This is a risk we don’t yet manage. This is a good way to start".
"I appreciate the level of expertise that you provided for the training sessions."
July 21, 2015
Drought Update
Drema Gross, Water Conservation Division Manager, Austin Water
Gray Water - Navigating Through City Code
Robert Stefani, Conservation Program Specialist, Austin Water
Gray Water - Projects and Irrigation Connections
Chris Maxwell-Gaines P.E., Innovative Water Solutions, LLC
Using Bulk Fill Stations
Bill Kemp, Caracara Farm
As Right As Rain
Betty Lambright, Earthworks and Landscape Design for Water Conservation
Contractor Use of Soils
Jared Pyka, ValleyCrest
Water Conservation Rebate Programs
Water Chris Charles, Austin Water
June 23, 2015
Green Infrastructure Working Group
Erin Wood - Watershed Protection Department
So You want to Build A Rain Garden
Tome Franke, EIT & Michelle Adlong, Watershed Protection Department
March 24, 2015
Plants Running Hot, Cold & Dry
Denise Delaney, City of Austin, Watershed Protection Department
Austin’s Tree Regulations
Michael Embesi, City of Austin Planning & Development Review
Landscaping with Trees for Water Conservation
Vincent Debrock, Texas Heritage Tree Care, LLC
Native Plant Combinations
Andrea DeLong-Amaya, Lady Bird Johnson Wildflower Center, The University of Texas at Austin
Professional Pruning
Lara Schuman, City of Austin Parks & Recreation Department
Plants for Rain Gardens & Bioswales
Elizabeth McGreevey + Solid Land Design
A Grower's Perspective
Pat McNeal, NcNeal Growers
February 24, 2015
Welcome - Opening Remarks
Denise Delaney, Watershed Protection Department
Meredith Gray, Parks & Recreation Department
Big Picture Local Food System
Edwin Marty, Office of Sustainability
Sustainable Landscaping with Tough Herbs
Colleen Dieter, Red Wheelbarrow
Alternative Ways to Water
Meredith Gray & Chris Sanchez, Parks and Recreation Department
Landscaping for Wildlife
LaJuan Tucker, Parks & Recreation Department
Rainwater Harvesting for Grow Green Professionals 5
Dick Peterson
January 15th, 2016
Bob Rose, LCRA Chief Meteorologist
Spring and Summer Weather Outlook
Lauren Stanley, Stanley Studios Architecture + Metalwork
Urban Nature: Propagating Green Roofs
Jonathan Garner, Lady Bird Johnson Wildflower Center the University of Texas at Austin
Introduction to the Sustainable Sites Initiative
Heather Venhaus, Regenerative Environmental Design, LLC
High Performance Urban Ecosystems
Staryn Wagner, Watershed Protection Department
Leaky Cisterns: Better Than Good, They're Great!
Katie Coyne, Asakura Robinson Company
Connecting Systems and People Using Urban Ecological Planning and Design
Kirby Fry, Southern Culture
Sustainable Design & Urban Permaculture
January, 29th, 2016
Hank Smith, Home Builders Association of Greater Austin
Sensible Landscaping for Central Texas
Brett Briant, Lower Colorado River Authority
Water Conservation Rebates and Programs
Amy Uyen Truong, Texas A&M Institute of Natural Resources
Forrest Cobb, Texas A&M Institute of Natural Resources
The Drought Survivability Study
Matthew Stamm, Cougar Irrigation
Efficient Irrigation Techniques
Susan Kenzle, RLA, LI, ISA
Darcy Nuffer, RLA, LI, LEED AP - City of Austin, Watershed Protection Department
Rain Gardens: Plant selection
Tom Franke - City of Austin, Watershed Protection Department
Michelle Adlong - City of Austin, Watershed Protection Department
So You Want to Build a Rain Garden… What have we learned so far?
February 12, 2016
Andrea DeLong-Amaya, Lady Bird Johnson Wildflower Center
Plant Selection for the Family Garden at the Lady Bird Johnson Wildflower Center
James Plyer, Native Texas Nursery
Trowel and Error: Overcoming the Challenges of Providing Native Plants (and sometimes not)
John Clement, Watershed Protection Department
Dealing With Invasive Plants in Residential and Commercial Landscapes
Liz McVeety, Parks & Recreation Department
Perils and Pleasures of Pruning
Keith Brown, Austin Tree Experts
Myths and Fact About Trees
Vincent DeBrock, Heritage Tree LLC
Trees and Soil: Why Landscapers are Key for the Urban Forest
February 26, 2016
Mitchell Wright ASLA, AICP, LEED AP, Vista Planning and Design
Festival Beach Food Forest Case Study
Meredith O'Reilly, 4-H CAPITAL Project/Texas A&M AgriLife Extension Service
Supporting Wildlife with Habitats and Integrated Pest Mana
Robinson Sudan, New Leaf and Pollinator Partnership
Role of Pollinators/IPM
Christopher Sanchez, City of Ausitn Parks and Recreation Department
Straw Bale Planting Demonstration
Cathy Downs, Hill Country Master Naturalist, Bring Back the Monarchs to Texas Program
Milkweeds and Monarchs Made
March 11, 2016
Justice Jones , Austin Fire Department
Firewise Design Considerations
Sarah Dooling, University of Texas at Austin School of Architecture
A Future Vision of Design Practice in the Context of Uncertainty, Rapid Change and Inequities
"Speakers seem very knowledgeable on their topics. Minimal repetition but building on each other well."
"Directed to us, the professionals. Up-to-date information; very insightful."
"Learned a lot of new tree care methods."
"Reminded me our natives are as beautiful as any landscape plants promoted by books for other parts of the US."
"Have really enjoyed just learning about people in the industry (speakers). Has expanded my scope and resource base."
"Really enjoyed the hands-on sessions."
Sustainability - January 15, 2016
Spring and Summer Weather Outlook
Urban Nature: Propagating Green Roofs
Introduction to the Sustainable Sites Initiative
High Performance Urban Ecosystems
Leaky Cisterns; Better Than Good, They're Great!
Connecting Systems and People Using Urban Ecological Planning and Design
January 20, 2017
Jason Traweek, City of Austin Development Services
Urban Forestry Grant Program
Rob Grotty, City of Austin Public Works
ROW Trees and You
Markus Smith, Just Trees
Tree Talk
Keith Babberney, City of Austin Development Services
Introduction to Tree Diagnosis
Amy Truong, Texas Water Resources Institute
Forrest Cobb, Texas A&M Institute of Renewable Natural Resources
The Drought Survivability Study (presentation)
The Drought Survivability (report)
Cathy Justice, Lady Bird Johnson Wildflower Center
Groundcovers and Habiturf
Hans Landel, Ph.D., Lady Bird Johnson Wildflower Center
Invasive Species and the Managed Landscape Horticultural Codes of Practice (UK)
Chinese Pistache Weed Risk Assessment
Chinese Privet Weed Risk Assessment
Golden Bamboo Weed Risk Assessment
Pampas grass Weed Risk Assessment
Ligustrum Texas Invasive Plant and Pest Council (TIPPC) Plant Assessment Form
Nandina Texas Invasive Plant and Pest Council (TIPPC) Plant Assessment Form
February 3, 2017
Grace Barnett, National Wildlife Federation
Battle for Butterflies
Greg Mast, Central Texas Food Bank
Fruit and Nut Trees
Andrea DeLong-Amaya, Lady Bird Johnson Wildflower Center
Taste of Place: Edible Native Plants
Chris Sanchez, Parks and Recreation
Food Forest Introduction
LaJuan Tucker, Parks and Recreation
Coyotes in Urban Places
Pat McNeal, McNeal Grower's
Oh Deer
February 17, 2017
Christopher Charles, Austin Water Utility
Waterwise Rainscape Rebate
Saul Nuccitelli, Watershed Protection
Proposed Drainage Discount Program
Dick Peterson, DickPeterson.com
Catch Me if You Can
Tom Franke, Watershed Protection
So You Want to Build a Rain Garden
Vincent DeBrock, Heritage Tree Care, LLC
Green Stormwater Infrastructure Case Study
Susan Kenzle & Haile Acayla Watershed Protection
Rain Garden Maintenance
March 3, 2017
Daphne Richards, Texas A&M AgriLife Extension Service
Understanding Plant Nutrition
Sabrina Viduarri, City of Austin Health and Human Services
Mosquitoes & Rodents
Erin Wood, Watershed Protection Dept.
Exploring the Green Elements of Code NEXT
Elizabeth McGreevy, Droplet Ecological Land Planning & Design
Gravel in the Landscape: Dos and Don'ts
Denise Delaney, Watershed Protection Dept.
Trowel and Error: Maintaining Naturalistic Landscapes
March 27, 2017
Chief Dawn Clopton, Austin Fire Department Wildfire Division
Introduction
Nate Casebeer, David Gimnich Austin Fire Department Wildfire Division
What and Where is the WUI (Wildland-Urban Interface)?
Rob Galbrath USAA Insurance Company
Insurance Risk Ratings
Bill Childs, Versante Canyon Firewise Community
Firewise Communities
Mark Baker, Austin Fire Department Wildfire Division
Landscape Design and Maintenance to Reduce Wildfire Risk in the WUI
"Lots of good information from people who have actually put procedures into practice & could report factual results."
"The sessions get better every year! Thanks!"
"Presenters were all excellent! Dynamic, inspiring, professional, knowledgeable!"
"Subject matter was something I can apply myself."
"I understand rain gardens so much better now and will be able to help others design & implement them."
January 18, 2018
The Subterranean City: Soil and Urban Sustainability
Dr. Kevin Anderson*, Austin Water
Making Informed Choices when Choosing Landscape Products
Phil Gosh, Organics by Gosh
Alternative Water Use
Robert Stefani, Austin Water
Setting Your SITES on Gold
Justin Hayes, UT Dell Medical District
Trees 101 for Landscape Professionals
Rebecca Johnson, Arborholic
Common Austin-area Tree Problems
Keith Babberney*, Development Services
February 1, 2018
2018 Landscape & Gardening Trends
Denise Delaney, Watershed Protection
Designing in Urban Landscapes
David Cazares, LEED, AP MWM Design Group
Technology in the Landscape Industry
Andrew Walsh, Terra Dura Landscaping
Firewise Landscape Design
Mark Baker, Austin Fire Department, Wildfire Division
Wildfire Division Presentation
Nia Henry, Austin Fire Department, Wildfire Division
Firewise Plants - Part One
Firewise Plants - Part Two
Michelle Bertelson, Lady Bird Johnson Wildflower Center
February 15, 2018
Water Conservation Update
Mark Jordan, Austin Water
Drainage Charge Discount
Anupa Gharpurey, Watershed Protection
Rainscape Rebates
Chris Charles, Austin Water
Rain Gardens: What Have We Learned
Tom Franke, Watershed Protection
Rain Gardens, et cetera
Susan Kenzle, Watershed Protection
Zilker Botanical Garden Stream Bed Plant List
David Mahler, Environmental Survey Consulting
Leaky Cisterns
Staryn Wagner, Watershed Protection
Design, Installation & Maintenance of Cisterns
Brad Krimmel, Texas Metal Tanks
March 1, 2018
Importance of Nature in our Lives
Dr. Cindy Klemmer, Parks & Recreation
Integrating Edible Plants into Traditional Landscapes
Greg Mast, Central Texas Food Bank
Native Bees and the Plants They Love (Invertebrate Conservation fact sheet)
Nests for Native Bees
Tunnel Nests for Native Bees (Invertebrate Conservation fact sheet)
Liz Cardinal, Sustainable Food Center
Wildlife Federation's Monarch Conservation Programs: Towards Protecting All Pollinators
M. Rebeca Quiñonez-Piñón, National Wildlife Federation
Chicken-keeping in the Landscape
Michelle Hernandez, Urban Poultry Association of Texas, Inc.
"The networking opportunities were really good!"
"The speakers were all very interactive & engaging – enjoyed the fluidity of the topics too!"
"I liked all of the hands-on segments."
"I learned a lot of good tree care tips"
"So excited to up my compost game! Definitely going to refresh the landscaping crew on tree planting!"
"The info SITES information was definitely helpful to keep in mind for future projects!!"
"I plan to take fire safety into consideration much more than I did before!"
"The technology in the landscape presentation gave lots of good information on new options for landscape industry applications."
"I plan to try to push more innovative uses for alternative water sources."
January 23, 2019 – Rainscapes and Cisterns
Introduction to Green Stormwater Infrastructure
Paige Oliverio, Urban Patchwork
Rain Gardens - Design & Installation
Tom Franke, Watershed Protection
Rain Gardens - Plants & Maintenance
Susan Kenzle & Darcy Nuffer, Watershed Protection
Rainwater Harvesting
Billy Kniffen, Texas A&M AgriLife Extension Service (retired)
Passive Cistern Design handout
Staryn Wagner, Watershed Protection
High Efficiency Irrigation and Holistic Water Management
Brenton Donnell, Innovative Irrigation Technologies
Drainage Utility Fee & Discount Program
Kellsey Schilly, Watershed Protection
February 7, 2019 – Sustainability
Planning for the Future: Sustainable Landscaping
Denise Delaney, Watershed Protection Department
Using Reclaimed Wood for Outdoor Projects
Andrew Danziger, Hatch Workshop and Harvest Lumber Co.
Growing for the Future: The Luci and Ian Family Garden
Andrea DeLong-Amaya, Lady Bird Johnson Wildflower Center
Handout
Designing with the Sustainable Sites® Initiative in Mind
Kimberly Gilbertson, MLA, Public Works
Green Roofs
John Hart Asher, Lady Bird Johnson Wildflower Center
February 21, 2019 - Trees, Edible Plants & Attracting Wildlife
Benefits of Nature
Dr. Cindy Klemmer, Parks & Recreation Department
How Trees Grow
Paul Johnson, Texas A&M Forest Service
Tree Regulations & Critical Root Zone
Cinthia Pedraza, Development Services Department
Attracting Wildlife
Kelly Simon, Texas Parks & Wildlife
Fruit Tree Pruning
Greg Mast, Central Texas Food Bank
March 7, 2019 - Fire & Water
Gray Water
Robert Stefani, Austin Water
Irrigation Technology
Johnny Anderson, Rachio
Reducing Wildfire Risk in Landscapes: Tools & Resources
Mark Baker & Mark Stinson, Austin Fire Department, Wildfire Division
"I am just happy that everyone else is finally catching up to the importance of rainwater harvesting."
"The speakers were all exceptional! I learned so much!! I'm looking forward to the other three training sessions. If they are half as good as this one was, I will be very pleased."
"Thank you for all of your efforts in organizing the speakers, wonderful lineup this year. Kudos!!"
"Came away feeling very inspired to work harder to keep water on the site, and to recommend others do the same."
"Thank you for bringing experts from different areas"
"Thanks for another fascinating and educational day!"
November 17, 2020
Videos
Description -
Design – Lessons Learned, Helen Ivor-Smith, Environmental Survey Consulting
Permeable Paver Installation & Maintenance, David Hasness, Keystone Hardscapes
Tree Care & Diagnosis, Daniel Priest, Development Services Department
Description -
Principles of Landscape Design, Merredith Jiles, Parks& Recreation Department
Presentations
Design – Lessons Learned, Helen Ivor-Smith, Environmental Survey Consulting
Permeable Paver Installation & Maintenance, David Hasness, Keystone Hardscapes
Tree Care and Diagnosis, Daniel Priest, Development Services Department
8 Principles of Landscape Design, Merrideth Jiles, City of Austin Parks & Recreation Department
November 18, 2020
Video
Description -
Planting Demonstration, TaraRose Macuch, Wild Heart Dirt
Designer’s Toolbox, Merrideth Jiles, City of Austin Parks & Recreation Department
Austin Water Rebates, Chris Charles, Austin Water
Presentations
Plant Selection Tips, Crystal Murray, Far South Grower’s
Designer’s Toolbox, Merrideth Jiles, City of Austin Parks & Recreation Department
Austin Water Rebates, Chris Charles, Austin Water
People who have never taken the training will get priority. If you have attended the series in the past and wish to take the entire series again please select that option on the registration form. On the registration deadline, Watershed Protection Department staff will review registration forms and if additional spaces are available they will be filled in the order registration forms were received.
You will be notified if registration for the full series is not available and given the option to register for individual classes instead.
Landscape contractors and developers, and property managers based in Austin; as well as City of Austin employees involved with landscape design, installation or management responsibilities are eligible to take the Grow Green Landscape Professional Training series.
To determine if a business is Austin-based we ask if you have a physical Austin address or have the majority of your customers in Austin when you complete the registration form.
Yes.
The City’s Green Garden program has been merged with the City’s Grow Green program to avoid confusion due to similar names and to reach more people with a consolidated website.
This series is now called Grow Green Landscape Professionals Training. The program continues to offer the same high-level of training and professionals who complete the training series will be recognized on the webpage for one year. After completing the entire series, professionals must attend one Grow Green training day per year to maintain their presence on the webpage.
Why has the word certification been taken out of the name?
After evaluating the program, it was determined the classes do not justify the term “Certified.” The City’s Grow Green program does not have the authority to provide landscaping certifications. All of the benefits will remain the same – only the name has changed.
Participants will continue to receive educational classes on a variety of timely topics, recognition on the Grow Green webpage, CEUs, and the right to link to the Grow Green webpage from their businesses websites.
The Landscape Professional Training Series has been on pause since 2020 due to Covid restrictions. The current listing reflects individuals that have been qualified since 2020. The list will remain posted until we either have another training or discontinue the program. If we do, maintain it, the requirement to stay listed will be that you will be required one day of the training each year to stay posted.
Let's Can It, Let's Can it - Traditional Chinese
- Causes pollution (from the breakdown of plastic, cigarette butts, batteries, motor oil, paint, and other toxic trash)
- Decreases oxygen levels as it decays in the creek
- Destroys aquatic habitat Harms animals living in water
- Decreases property values
- Attracts other types of crime
- Makes the City look ugly
- Cost taxpayers money to clean up
Wind and rainwater wash pollutants downhill to the lowest point in the area - the creek or the lake. Trash is the largest and most visible pollutant in urban creeks.
Local Flooding
Localized flood issues are typically identified in one of two ways. Either residents contact the City to report flooding of their property or street or City staff identify problem areas based on evaluations of the existing storm drainage system. We strongly encourage residents to report any flooding issues since this brings to light new problem areas and allows City staff to confirm problems identified through studies.
Austin has over 900 miles of storm drains, over 30,000 inlets, and about 200 miles of drainage ditches.
Call 3-1-1. The Watershed Protection Department will send someone to document the standing water, research the cause and determine whether the City may be able to help with a solution.
Monitoring the situation and get ready to potentially evacuate. The flooding may get much worse very fast. Keep in mind that the road providing access to your home may become impassible before water enters your house. Leave before the road is flooded.
If there’s time, the following steps can help limit damage:
Turn off all utilities at the main power switch and close the main gas valve if evacuation appears necessary.
Move valuables, such as important papers, jewelry, and clothing to upper floors or higher elevations.
Fill bathtubs, sinks, and plastic soda bottles with clean water. Sanitize the sinks and tubs first by using bleach and rinsing.
Bring outdoor possessions, such as lawn furniture, grills, and trash cans inside, or tie them down securely.
For guidance in how to prepare an evacuation kit or stock emergency supplies ahead of time, visit Homeland Security and Emergency Management.
Plants
Rain Catcher Pilot Program
The upper portion of the Waller Creek watershed was selected as the study area for the modeling exercise and the pilot program for several reasons. It is the smallest, fully-urbanized section of a watershed for which we have long-term data about flows in the creek. These things are important because:
- Urbanized - Being fully urbanized is important because in order to examine the effects rain gardens and cisterns have on the creek the study area and data should not be confused by large changes in development.
- Small - A small area helps us implement a meaningful program on the ground and measure the effects in a reasonable time frame, years instead of decades.
- Long-term data - Having long-term data about the creek helps us capture the natural variability in the creek flows before cisterns and raingardens are implemented. This helps us measure if there are changes in a rigorous way.
The City of Austin’s Rain Catcher Pilot Project is collaborating with The Nature Conservancy through their Build Healthy Cities initiative to learn about motivators for adopting green stormwater infrastructure. Behavioral science suggests that behavioral nudges, especially those that leverage social influences, may be powerful motivators that could lead to increased adoption rates in the pilot program. The Nature Conservancy is providing guidance plus conducting surveys and small focus groups to help refine outreach related to this pilot program. These finds can be applied to other urban conservation programs.
Salamanders
Between December 18-20, 2018, City of Austin staff observed and investigated three separate, discrete discharges of sediment to Barton Springs Pool, directly from the Edwards Aquifer. The discharges caused unusual turbidity, but not acute, adverse impacts to the aquatic life of the pool, nor long-term harm to the water quality of Barton Springs Pool. City of Austin staff worked with the Barton Springs Edwards Aquifer Conservation District (BSEACD) to identify the source of sediment as geothermal/heat pump well drilling activity that was permitted by the BSEACD.
The wells are located in the confined zone just east of the recharge zone, about a mile from the springs, and the timing of the well-drilling activity coincided with the appearance of the urbitity at the springs and the known travel time of water in the aquifer.
The City of Austin issued a citation under Austin City Code Title 6, Chapter 5 for a pollutant discharge to a waterway.
The wells were completed and closed on Friday, December 28, 2018, under supervision from the BSEACD. The City of Austin does not anticipate any further discharges from this activity.
As of January 2019, the City and the BSEACD are working together to develop criteria to address these types of wells in the future. This type of well drilling is a new phenomenon to this area, so the impact was not anticipated. Now that it has happened once, the two entities can adjust our respective protocol to ensure more preventative practices and increased inspection and monitoring for this type of activity.
This video shows how aquatic salamanders respire. This close-up of an Austin Blind Salamander shows red blood cells rapidly moving through capillaries in the salamander’s gills. In this process, the red blood cells pick up oxygen in the water and release carbon dioxide as they move through the gills, just like our lungs when we breathe air.
- Aquatic its entire life
- Needs flowing water with a fairly consistent temperature of 70ºF
- Thought to spend all or most of its life in the aquifer
- Occasionally individuals observed at the surface; may have been washed through the spring outlets
- Eggs have been observed in captivity, but not in the wild
- ½” to over 3” long
- Translucent surface with three pairs of red external gills
- Pearly-white to lavender colored
- Square-shaped snout
- Eye-spots, but no image-forming eyes
- Eats aquatic macro invertebrates and may eat juvenile salamanders or salamander eggs
The Austin Blind Salamander is known only from Barton Springs. Unlike the Barton Springs Salamander, Austin Blind Salamanders are not typically seen near the surface. Austin Blind Salamanders occupy the habitat below the surface of the springs, where their unique adaptations likely give them a selective advantage in a world of total darkness and limited food. They have been found in all four of the springs collectively known as Barton Springs: Parthenia in Barton Springs Pool, Old Mill (Sunken Garden), Eliza and Upper Barton. Unfortunately, because their habitat is not readily accessible by humans, and they are only occasionally observed in the springs, very little is known about the natural history of this species.
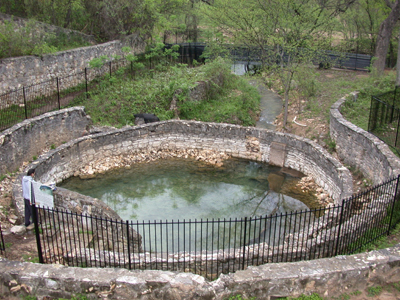
Old Mill Spring (Sunken Garden) in Zilker Park is the site where the Austin Blind Salamander (Eurycea waterlooensis) was first collected.
Interestingly, another large spring in Texas is also home to a pair of salamander species: San Marcos Springs in San Marcos (Hays Co.) has surface-dwelling San Marcos Salamanders (Eurycea nana) as well as the subterranean Texas Blind Salamanders (Eurycea rathbuni).
Because the Barton Springs Salamander is an endangered species, the City of Austin must have a permit from the U.S. Fish and Wildlife Service to continue the operation of Barton Springs Pool and associated scientific investigations. The permit is issued under the Endangered Species Act Section 10(a)(1)(B) and is referred to as an incidental take permit. The City’s current permit, issued in 1998, expires in October 2013. You can download a copy of the current permit here: Current US FWS Permit
The federal permit is based on the conservation measures described in the City's Habitat Conservation Plan. The plan details the actions the City will conduct that may adversely impact the Barton Springs Salamander, and how the impact of those actions will be reduced or compensated to protect the species. The plan can only cover actions by the City in and around Barton Springs Pool that may affect the Barton Springs Salamander and does not involve any actions associated with the Jollyville Plateau Salamander in northwest Austin or actions outside of the City's jurisdiction in the contributing zone of the Edwards Aquifer.
You can download the current Habitat Conservation Plan here: Existing EA and HCP. The new Habitat Conservation Plan will not be substantially different from the current version, but will cover the Austin Blind Salamander, in advance of its probable listing as a new endangered species. The new plan may modify some existing conservation measures based on the accrued experience of the City and extensive population studies since the original plan was developed in 1998, and will consider the potential improvements to Barton Springs Pool identified in the pool master plan. Despite growing threats to the salamander from increased pumping of groundwater and urbanization in the contributing zone of the aquifer, the City's conservation actions have significantly improved the salamander population since the species was listed as endangered.
Because of the long review process associated with federal endangered species permit actions, the City is starting on the development of the new Habitat Conservation Plan now to insure that the permit is renewed prior to expiration and Barton Springs remains open. There was series of public outreach efforts in Fall 2011. Email your questions and comments to this address: salamander@austintexas.gov
All three Eurycea salamanders that inhabit Austin springs are members of the family Plethodontidae, which is the largest family of salamanders. They are within the sub-family Spelerpinae, which includes four genera: Eurycea, Gyrinophilus, Pseudotriton, and Stereochilus. A total of thirteen species are now described from this group of (mostly) perennibranchiate salamanders that inhabit central Texas.
Very little was known about any of Austin’s endemic brook salamanders prior to the 1990s, even though they consisted of three very different species. Prior to discovery and formal description of each species, the majority of brook salamanders (genus Eurycea) found in spring-fed surface streams throughout the Edwards Plateau of central Texas (including the Jollyville Plateau) were considered Eurycea neotenes, the Texas Salamander. In the mid-1990’s, biologists undertook studies to understand the ecology (the relationships between the salamander and its environment) and evolutionary history (e.g., the genetic relationships between the salamander and other species) of this group of salamanders. Through those studies, biologists discovered that the Texas Salamander was, in fact, comprised of several genetically distinct species. The true range of the Texas Salamander is actually restricted to the springs and caves of Bexar, Comal, and Kendall Counties. Two of the newly discovered species were Austin’s own E. tonkawae, the Jollyville Plateau Salamander2, and E. sosorum, the Barton Springs Salamander1.
The primary reason so many different species across a relatively broad geographic range were considered conspecific (the same species) is that all of the Edwards Plateau species are very similar in appearance. Before the invention of methods to examine DNA and protein molecules, differences in physical appearance, or “morphology,” were the basis for distinguishing one species from another. At that time there was no evidence to classify the Edwards brook salamanders as separate species. Once scientists learned how to test molecules and use the results to identify and group species based on their genetic relationships (the science of molecular systematics), the unique genetic characteristics of each species of salamander became apparent, and each could be classified.
Of course there were some exceptions to this prior “lumping” of different species under one name. Most notably are the subterranean species, Austin Blind Salamander, Blanco Blind Salamander, and the Texas Blind Salamander, who exhibit very obvious and extreme differences in the morphology of their bodies and heads. For one, they are “blind,” or to be more specific, they lack an image forming eye. They also tend to have larger, shovel-shaped heads. These features are believed to confer an advantage for living in complete darkness, although scientists still debate the origin of troglomorphic characters as “regressive evolution” or resulting from natural selection. Before the discovery of the Austin Blind Salamander in Barton Springs, the members of this group were considered to be in a different genus altogether (Typhlomolge) because of their extreme morphology. But once again the molecular data2,3 allowed biologists to learn that these species are genetically similar enough to the other Edwards Plateau species to be included in the genus Eurycea.
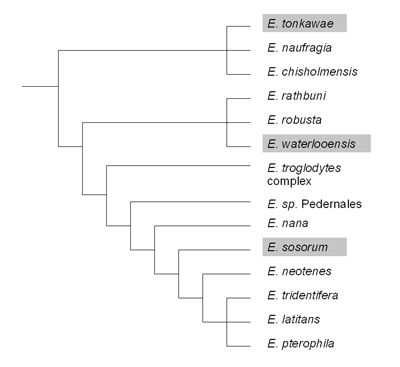
A cladogram showing the evolutionary relationships of the central Texas Eurycea salamanders. Species that occur in Austin are highlighted in grey. Branch lengths do not reflect genetic distance or substitution rate. Note that none of the species in Austin are each other’s closest relatives; thus illustrating the complex and interesting evolutionary history of this group. From Chippindale et al. 2000 and Hillis et al. 2001.
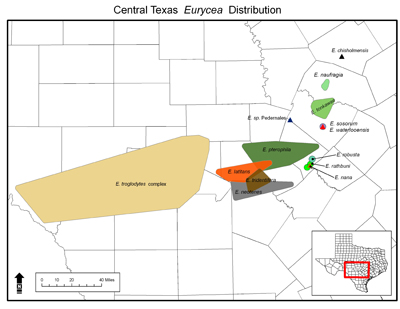
Range map of all the central Texas Eurycea salamanders.
Most of what we know about the life history of Austin Eurycea is based on observations made of the salamanders while in captivity. While many of these observations are of the Barton Springs Salamander, some characteristics (such as courtship) are thought to be common to the whole group. Courtship behavior involves a series of steps called a “tail-straddling walk,” which is characteristic of the family (Plethodontidae) of salamanders to which central Texas Eurycea belong. In the “walk,” the female straddles the male’s tail and rubs her chin on the base of his tail as he walks slowly forward; he stops at times and undulates his tail, possibly dispersing pheromones or showing her the location of his spermatophore. He eventually deposits a spermatophore that she will pick up in her cloaca. The eggs will be fertilized as they pass through the oviduct as they are being laid. After courtship, the female may wait months or a year or more before she lays her eggs. It is not known whether multiple males sire a single clutch of eggs.
The female (white eggs are noticeable in her abdomen) follows the male, he undulates his tail, possibly showing her where he has deposited his spermatophore.
All three species are thought to lay their eggs in the aquifer below the surface (especially so for the Austin Blind, who rarely visits the surface). This is because only a few eggs have ever been found in the wild; those eggs were thought to have accidentally washed up on the surface of the spring. Egg-laying events have only been observed in captivity.
On average, a female lays 15 eggs in a clutch. The eggs are laid singly and this process can take 12 hours or more. The ova are white and are surrounded by several layers of a clear capsule that is permeable for gas exchange. The capsule protects the embryo and is sticky, which presumably allows the female to lay the eggs on rocks in flow.
This is a time lapse video of embryo development for the Barton Spring Salamander. Notice the development of the eyes, gills, front limbs, and the heart beating in the throat area. This individual developed the back limbs after hatching.
The eggs hatch in 3-4 weeks. Hatchlings are ~½” total length (snout to tip of tail), often without fully formed limbs. Juvenile salamanders become sexually mature at about 11 months (50mm total length) and grow to about 3 inches as adults. Salamanders can continue to reproduce to an age of at least eight years.
Good longevity data is currently only available for captive salamanders, although an ongoing mark-recapture project on the Jollyville Plateau Salamander should provide substantial data on survival in the wild for that species. A female Barton Springs Salamander was collected as an adult in 1996. She is thought to be the oldest wild-caught salamander in the program, but the exact age is difficult to determine because the hatch date of an adult collected in the wild is unknown. A male that hatched in captivity in 1997 is the oldest captive-raised salamander in the program.

The salamanders are one-half inch in length when they hatch and grow to about 3 inches in total length as adults. They have a muscular tail used for swimming. They do not spend much time swimming in the water column, however, and instead walk along the substrate*. They have 4 toes on their front feet and 5 toes on their back feet. The color variation for the Barton Springs Salamander includes shades of pink, purple, brown, orange, red as well as white spots called iridophores. The Austin Blind Salamander is generally lavender or purple with white iridophores.
![]()
This is a cleared and stained specimen of E. sosorum. The “clearing” process makes proteins transparent while the “staining” stains all cartilage blue and bone red. This is a very useful technique to allow researchers to study the bone structure of an amphibian without destroying the connective tissue.
The Barton Springs and Jollyville Plateau salamanders have eyes with image-forming lenses to help them see predators and prey. In contrast, the Austin blind salamander only has eyespots that may help it detect light. It cannot see and does not need eyes in the darkness of the aquifer.
Notice the color variation between the individual Barton Springs Salamanders shown in the video of the animals in the wild (see section on Austin Blind).
Central Texas Eurycea are aquatic their entire lives. This video shows how aquatic salamanders respire. This close-up of an Austin Blind Salamander shows red blood cells rapidly moving through capillaries in the salamander’s external gills. In this process, the red blood cells pick up oxygen in the water and release carbon dioxide as they move through the gills, just like our lungs when we breathe air.


These photos were taken of the same individual Jollyville Plateau Salamander, but several months apart spanning a dry period. Notice the drastic difference in gill size. Salamander gills will change in size in response to their environment over time. Large bushy gills help in an oxygen-poor environment, such as when the springs go dry and they must retreat underground to follow the water table.
*substrate-the rocks and sediment on the bottom of the stream
Most of what we know about the ecology of Austin’s aquatic salamanders is from studies conducted by the City of Austin on the more easily accessible surface populations. Their diet, like most salamanders, is entirely carnivorous. Based on field observations, fecal content analysis, and new radio-isotope data, they eat a variety of prey that is likely based on both what is available and what fits in their mouth. This includes a variety of snails (Gastropoda), seed shrimp (Ostracoda), copepods (Copepoda), amphipods, insects (such as midge, mayfly, and damselfly larvae, aquatic beetles, etc.), flatworms (Planaria), segmented worms (Annelida), and others.

Amphipods in Eliza Spring.

Barton Springs Salamander eating Amphipods

Predatory Fish
Relationships between the salamanders and their predators are not well understood. Some evidence suggests freshwater sunfish and basses opportunistically feed on salamanders. In the past, many salamander habitats were too shallow to harbor these fish species. Now these fishes have more available permanent and stable habitat in salamander streams because of direct and indirect stream channel modification by humans (e.g. dams creating Barton Springs Pool). Predatory fish presence may hinder dispersal where unnatural intermittent pools intercept the stream pathways that were once more shallow riffles or runs. Recent evidence clearly shows that chemical cues from predatory fish can negatively affect salamander activity.

Crayfish are common in both shallow and deep waters and can be found in nearly every salamander habitat. Crayfish are generalist predators, eating a variety of things from fish and tadpoles to plants and detritus, and have been observed feeding on juvenile Barton Springs Salamanders.
So, it is not unlikely that they are also a common Jollyville Plateau Salamander predator. Interestingly, the burrows created by crayfish may be beneficial in some ways to Jollyville Plateau Salamanders. One theory is that crayfish burrows may act as a path for salamanders to retreat through dense sediment and gravel to reach subsurface waters during dry periods.

Other large invertebrates have been observed feeding on salamanders. Giant water bugs (Lethocerus uhleri) are large ambush predators (up to 65mm) and have been seen at several monitoring sites preying on salamanders, ranid tadpoles, and mosquito fish (Gambusia affinis).
Damselfly larvae of the genus Archilestes are long and slender ambush predators that prey on very small juveniles if given the opportunity.
Cannibalism has also been documented in this species. Adults have been observed regurgitating the remains of juvenile salamanders when captured. This in part helps to explain why juveniles are often found in areas where adults are not, such as in very shallow water on the edge of the stream.
Unlike the surface populations, cave-dwelling Jollyville Plateau Salamanders are the top predators of that ecosystem. The downside, however, is that prey availability is much lower. Because all troglobitic organisms live in total darkness, there are no primary producers, so they must rely on nutrient input from the surface. The salamanders likely feed on available troglobitic and troglophilic (can live inside and outside caves) crustaceans and insects and potentially accidental prey washed into the caves during rain events.
Because the Barton Springs Salamander and the Austin Blind Salamander are federally endangered species, the City of Austin must have a permit from the U.S. Fish and Wildlife Service to continue the operation of Barton Springs as a recreation area. The permit is issued under the Endangered Species Act Section 10(a)(1)(B) and is referred to as an incidental take permit. The City’s first incidental take permit was issued in 1998 and would have expired in October 2013.
The federal permit is based on conservation measures described in a Habitat Conservation Plan. The Barton Springs Habitat Conservation Plan details the actions the City will conduct that adversely affect the Barton Springs Salamander and the Austin Blind Salamander and their habitats, and how the impact of those actions will be reduced or compensated to protect both species. The plan can only cover actions by the City in and around Barton Springs that may affect the Barton Springs Salamander or the Austin Blind Salamander and does not involve any actions associated with the federally threatened Jollyville Plateau Salamander in northwest Austin or actions outside of the City's jurisdiction in the contributing zone of the Edwards Aquifer.
City salamander biologists revised and expanded the Habitat Conservation Plan for Barton Springs in July 2013 after a 2-year process involving citizen input and extensive coordination with the U.S. Fish and Wildlife Service. The current incidental take permit from the U.S Fish and Wildlife Service was issued in September 2013 and will expire in 2033.
You can download a copy of the City’s incidental take permit and associated habitat conservation plan here.
- Watershed Protection Department Publications Database
- Articles in journals
- A new species of subterranean blind salamander (Plethodontidae: Hemidactyliini: Eurycea: Typhlomolge) from Austin, Texas, and a systematic revision of central Texas paedomorphic salamanders
- Demographics, reproduction, growth, and abundance of Jollyville Plateau
sSalamanders (Eurycea tonkawae) - Computer-assisted photo identification outperforms visible implant elastomers in an endangered salamander, Eurycea tonkawae
- Biogeography, phylogeny, and morphological evolution of central Texas cave and spring salamanders
- Body length shrinkage in an endangered amphibian is associated with drought
- Effect of urbanization on abundance of Jollyville Plateau Salamanders (Eurycea tonkawae)
- Movement, demographics, and occupancy dynamics of a federally threatened salamander: evaluating the adequacy of critical habitat
- Density‐dependent and density‐independent drivers of population change in Barton Springs salamanders
- Variation in Abundance in the Barton Springs Salamander Associated with Flow Regime and Drought
- New occurrence records for Eurycea sosorum Chippindale, Price & Hillis, 1993 (Caudata, Plethodontidae) in Travis and Hays counties, Texas, USA
Scoop the Poop
The Scoop the Poop program does not install dispensers, but we provide dispensers:
- to parks maintained by the City’s Parks and Recreation Department (PARD); please call 311 to request that PARD consider a particular location
- to Neighborhood Partnering Program projects
Scoop the Poop can also provide clip-on, refillable pet waste bag holders for community events, such as neighborhood association meetings or block parties (dependent on availability)
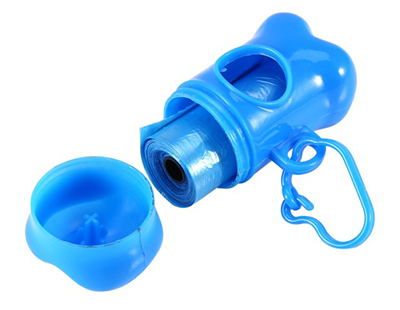
Yes – by City Ordinances, animal owners and handlers must pick up after pets.
§ 3-4-6 DEFECATION BY A DOG OR CAT. "An owner or handler shall promptly remove and sanitarily dispose of feces left on public or private property by a dog or cat being handled by the person, other than property owned by the owner or handler of the dog or cat.” Potential fine: Up to $500.
§ 15-6-112 - ACCUMULATIONS AND DEPOSIT OF WASTE PROHIBITED. (A) A person commits an offense if the person deposits, causes to be deposited, or permits to accumulate any dry or wet solid waste upon any public or private premises within the city in such a manner as to emit noxious or offensive odors or to become unsanitary or injurious to public health or safety.
§ 3-2-11 - ENCLOSURE REQUIRED. (A)(3) maintained in a sanitary condition that does not allow flies to breed or cause an odor offensive to an adjacent residence or business
Please call our Pollution Prevention Hotline (512 ) 974-2550 ANYTIME (24 hours/7 days).
If you’d like to help raise awareness in your area, please visit www.ScoopthePoopAustin.org to view our FREE educational resources, including small yard signs, brochures, newsletter articles, and posters.
Austin Police Department has the enforcement authority to fine violators if an APD officer witnesses the infraction. If you’d like information on accusing a violator through the municipal court system, please call 3-1-1 for more information.
Shade Tree Mechanic
- Home mechanics and hobbyists interested in the program may request an onsite evaluation of their current practices by contacting Patrick Kelly, Environmental Compliance Specialist Sr. with the Pollution Prevention Reduction Team via email or 512-974-2230.
- The Shade Tree Mechanic Program also reaches out to home mechanics that are recommended for the program by a neighborhood association, Austin Police Department officer or a spills team investigator that witnesses discharges of automotive fluids from a residence. A Pollution Prevention Reduction representative will then attempt to make contact with the responsible party to provide education and invite them to enroll in the program if they are interested.
What are my obligations as a participant?
- Simple. Those that agree to participate in the program and receive the free bucket are expected to be responsible in their automotive repair practices.
- Participants must be willing to provide minimal personal information (Name, address and email)
- Participants may be contacted periodically and at the end of each fiscal yearonce a year to perform a follow up visit, or conduct a brief survey to assist us in assessing the overall success of the program and its effectiveness at reducing pollution associated with automotive repair.
- Tell your friends about the program so we can keep it growing.
What else can I do to help?
- Recycle your used oil
-
Report any pollution or spills 24 hours a day through the pollution hotline at 512-974-2550
- Mark Storm Drains
- Subscribe to be emailed when volunteer events are created like planting native plants along Grow Zones or creating a rain garden at a school.
- A representative of the Pollution Prevention Team will come out to perform an assessment, provide recommendations and determine eligibility
- Eligible participants will receive a free oil change bucket specially designed to capture waste oil and secure for transport to any used oil drop off location
Recycling Bucket Instructions
1. Remove the bucket lid. It is designed to be the drain pan for the oil change.
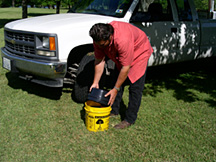
2. Slide the lid beneath the oil filter to prevent spillage. Place the filter directly into the lid. Then place the lid beneath the drain plug to capture the used oil.
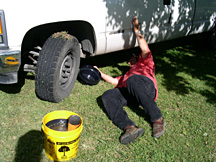
3. Fully drain the used oil into the lid & replace the drain plug. Prime the new oil filter and install. Refill the engine with fresh oil.
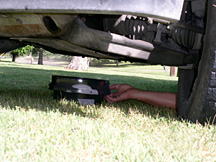
4. Remove the filter from the lid and place open end inside the bucket. Tip the lid and pour the oil into the bucket.
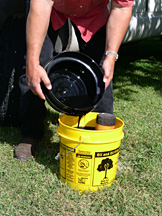
5. Replace the lid onto the bucket keeping the lip within the rim of the bucket to prevent drips.
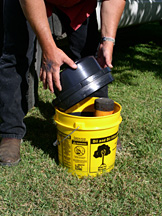
6. Firmly press the lid
7. Take automotive waste to Household Hazardous Waste or one of many oil recycling locations
- Recycle your used oil
- Report any pollution or spills 24 hours a day through the pollution hotline at 512-974-2550
-
Volunteer!
- Mark Storm Drains
- Subscribe to be emailed when volunteer events are created like planting native plants along Grow Zones or creating a rain garden at a school.
Storm Drain Marking
- The program runs year-round, so participants can sign-up to participate whenever is convenient for their schedule.
- The program provides the supplies needed, including maps, storm drain markers, safety vests, etc. The equipment is loaned for one month.
- Request an appointment with the program coordinator – located at One Texas Center, 505 Barton Springs Rd, 11th Floor. Please give the program coordinator at least 2 weeks advanced notice and list a few date/time options for the orientation (5-10 minutes long)
- Meet with the program coordinator at your appointed time, check out supplies, and sign paperwork.
- Mark drains and record information
- Return supplies and information to the program coordinator within one month of checking out supplies.
Who Can Participate?
- Anyone! This volunteer program is great for groups or individuals.
- Volunteers ages 17 and under must be accompanied by an adult.
Send the following information to the program coordinator:
- The number of people who will mark drains (and note if any participants are under age 18)
- The area of town most convenient for you (name a street intersection) or if you are willing to work anywhere there is a need
- Possible times/dates to set up a 5-10 minute appointment to review the process and sign paperwork.
Waste
- Pick up pet waste… every stinkin’ time!
- Throw away litter
- Keep leaves, cut grass and other yard waste away from storm drains
Vehicles
- Home Eco Mechanic - For do it yourself earth-wise vehicle maintenance
- Austin Clean Water Partners - Local automotive repair and fueling business that go the extra mile to protect our environment.
- Use a car wash, or wash your vehicle where the soap and water flow into the grass
Lawns
Notify the City about pollution problems, including leaks, spills, and dumping. Pollution Hotline - 512-974-2550
Who Can Participate?
- Anyone! This volunteer program is great for groups or individuals.
- Volunteers ages 17 and under must be accompanied by an adult.
Stormwater Management
Using physical and biological treatment mechanisms, biofiltration uses an organic filtration media with vegetation to remove pollutants. As with sedimentation/filtration systems, runoff is first diverted into a sedimentation basin, where particulate pollutants are removed via gravity settling. This is followed by filtration through an 18" layer of vegetated media.
Biofiltration systems are considered to provide a level of treatment equivalent to sedimentation/filtration, and also provide extended detention that enhances baseflow and reduces stream erosion. Biofiltration systems are not allowed in Barton Springs Zone (BSZ) watersheds as a stand-alone water quality control, as they are not capable of achieving a non-degradation level of treatment.
Because of the vegetation, biofiltration systems can be aesthetic amenities and may be eligible for landscape credit (unlike sedimentation/filtration systems). To ensure proper management of the pond system, filtration media, and vegetation, an Integrated Pest Management (IPM) Plan is required.
The current design criteria is similar to that for sedimentation/filtration systems, and two design alternatives are available. In “full” sedimentation/filtration systems the entire water quality volume is held in the sedimentation basin, which then slowly discharges runoff to the filtration basin via a perforated riser pipe. The alternative “partial” sedimentation/filtration design foregoes the perforated riser pipe, and distributes the water quality volume between the filtration basin and a sediment chamber, the latter separated from the filtration bed by a vegetated hedgerow. The “full” design is required when the City of Austin is responsible for maintenance.
Design guidelines for biofiltration can be found in Section 1.6.7.C of the Environmental Criteria Manual. For information on the biofiltration media, go to biofiltration media guidance. Also available is a list of potential suppliers.

Below is a list Biofiltration Media Suppliers that we are aware of.
Organics "By Gosh"
Sherry Williams
Wholesale Bulk
Account Executive
512-872-1434
Organics "By Gosh"
2040 FM 969
Elgin, TX 78621
sherry@organicsbygosh.com
Integrated pest management (IPM) is an environmentally-sound method of controlling pests (weeds, diseases, insects or others). Pests are identified, action thresholds are considered, all possible control options are evaluated, and selected control(s) are implemented. Control options used to prevent or remedy unacceptable pest activity or damage include:
• Biological - recognize, encourage, and/or introduce beneficial predators in your landscape • Cultural - plant native, pest-resistant plant varieties, and give them proper light, water and nutrients • Mechanical - hand-pick insects, or use traps, barriers, or water blasts to infected areas • Chemical - use botanical, mineral, and insecticidal soap or synthetic chemicals
Choice of control option(s) is based on effectiveness, environmental impact, site characteristics, worker/public health and safety, and economics. IPM takes advantage of all appropriate pest management options.
Learn more about Integrated Pest Management.
Click here to download a Green Stormwater Infrastructure Maintenance Manual.
The City of Austin requires landscaping for development. Additional non-required vegetation, especially trees, can help reduce stormwater runoff and enhance groundwater recharge by breaking the impact of raindrops and improving soil structure. A tree's effectiveness in this capacity is correlated with the size of the crown and root zone area.
There are numerous environmental and stormwater benefits to additional vegetation. Non-required vegetation can act as a natural stormwater management area by filtering particulate matter, including pollutants, some nutrients, sediments, and pesticides, and by absorbing water. A study done by the U.S. Department of Agriculture's Center for Urban Forest Research found that a medium-sized tree can intercept 2,380 gallons of rain per year (Center for Urban Forest Research 2002).
Non-required vegetation is eligible for water quality credit, in terms of pervious area (impervious area reduction), if it meets the criteria described in Section 1.6.7.G of the Environmental Criteria Manual. However, it is not eligible for credit in the Barton Springs Zone (BSZ)watersheds.
Unlike conventional centralized stormwater management systems, rain gardens may employ multiple controls dispersed across a development, and may be incorporated into the landscape to provide aesthetic as well as ecological benefits.
Rain gardens can be designed to provide a level of treatment equivalent to sedimentation/filtration, and also provide extended detention that enhances baseflow and reduces stream erosion.
Non-required vegetation requires an Integrated Pest Management (IPM) Plan.
- Non-Structural Controls are Best Management Practices (BMPs) that do not involve a structured, or engineered solution. They include such measures as education, site planning, and stormwater management regulations. Because it is usually easier and more effective to prevent pollution before it occurs, non structural BMPs are very cost-effective. These measures limit or eliminate pollutants before they end up in the stormwater.
- Non-structural controls include: non-required vegetation, vegetated filter disconnect, integrated pest management, and regulations.
Porous Pavement includes a load-bearing, durable concrete surface together with an underlying layered structure that temporarily stores water prior to infiltration. Porous Pavement is a water quality control best management practice (BMP) using the storage within the underlying structure or sub-base to provide groundwater recharge and to reduce pollutants in stormwater runoff.
To ensure proper functioning of porous pavement, no off-site runoff is allowed and proper subgrade conditions must exist.
Porous pavement is currently only allowed for pedestrian use and not for parking lots, stormwater hot spots, or areas where land use or activities generate highly contaminated runoff. Since porous pavement is an infiltration practice, it should not be applied at stormwater hot spots due to the potential for ground water contamination.
Environmental Criteria Manual 1.6.7.E of the Environmental Criteria Manual

A rain garden is a vegetated filtration and/or infiltration system that has a contributing drainage area not to exceed two acres, and a ponding depth not to exceed twelve inches.
Unlike conventional centralized stormwater management systems, rain gardens may employ multiple controls dispersed across a development, and may be incorporated into the landscape to provide aesthetic as well as ecological benefits.
Rain gardens can be designed to provide a level of treatment equivalent to sedimentation/filtration, and also provide extended detention that enhances baseflow and reduces stream erosion.
Rain Garden FAQs
Can rain gardens be used in the Barton Springs zone as a stand-alone water quality control?
No – Rain Gardens are not allowed in Barton Springs Zone (BSZ)watersheds as a stand-alone water quality control, as they are not capable of achieving a non-degradation level of treatment. The use of a Rain Garden as a water quality control is limited to Commercial and Multi-Family developments only.
Are rain gardens eligible for landscape credit?
Yes - Because of the vegetation, rain gardens can be aesthetic amenities and may be eligible for landscape credit (unlike sedimentation/filtration systems).
What is an IPM plan?
IPM stands for Integrated Pest Management. To ensure proper management of the pond system, filtration media, and vegetation, an Integrated Pest Management (IPM) Plan is required. www.austintexas.gov/ipm
Where can I find design guidelines?
Design guidelines for rain gardens can be found in Section 1.6.7.H of the Environmental Criteria Manual. Click here for guidelines and resources for small scale green stormwater infrastructure.
Where can I learn more about biofiltration media?
The rain garden filtration media is the same as that used for biofiltration systems. For information on the biofiltration media go to the Biofiltration Media guidance document.
Where can I find a list of potential biofiltration media suppliers?
Click here for a list of potential biofiltration media suppliers
Rooftops can generate large volumes of runoff which, when discharged to paved surfaces and landscaped areas, can generate large pollutant loads. Rainwater harvesting systems can capture this runoff before it is discharged, thus preventing pollution while also putting the captured water to beneficial use, such as landscape irrigation or cooling water.
Rainwater harvesting is eligible for water quality credit only for commercial development. The amount of credit will depend on the size (water quality volume) and drawdown time of the system. Rainwater harvesting systems can provide equivalent treatment to a sedimentation/filtration system, or be designed to meet a non-degradation level of treatment required in Barton Springs Zone watersheds. An Integrated Pest Management (IPM) Plan is required if the captured rainwater is applied to vegetation.
Design guidelines for rainwater harvesting can be found in Section 1.6.7.D of the Environmental Criteria Manual.
The Water Conservation staff of the City of Austin Water Utility is available to provide input on how to achieve cost-efficient design and equipment selection that will also help reduce water and wastewater costs.


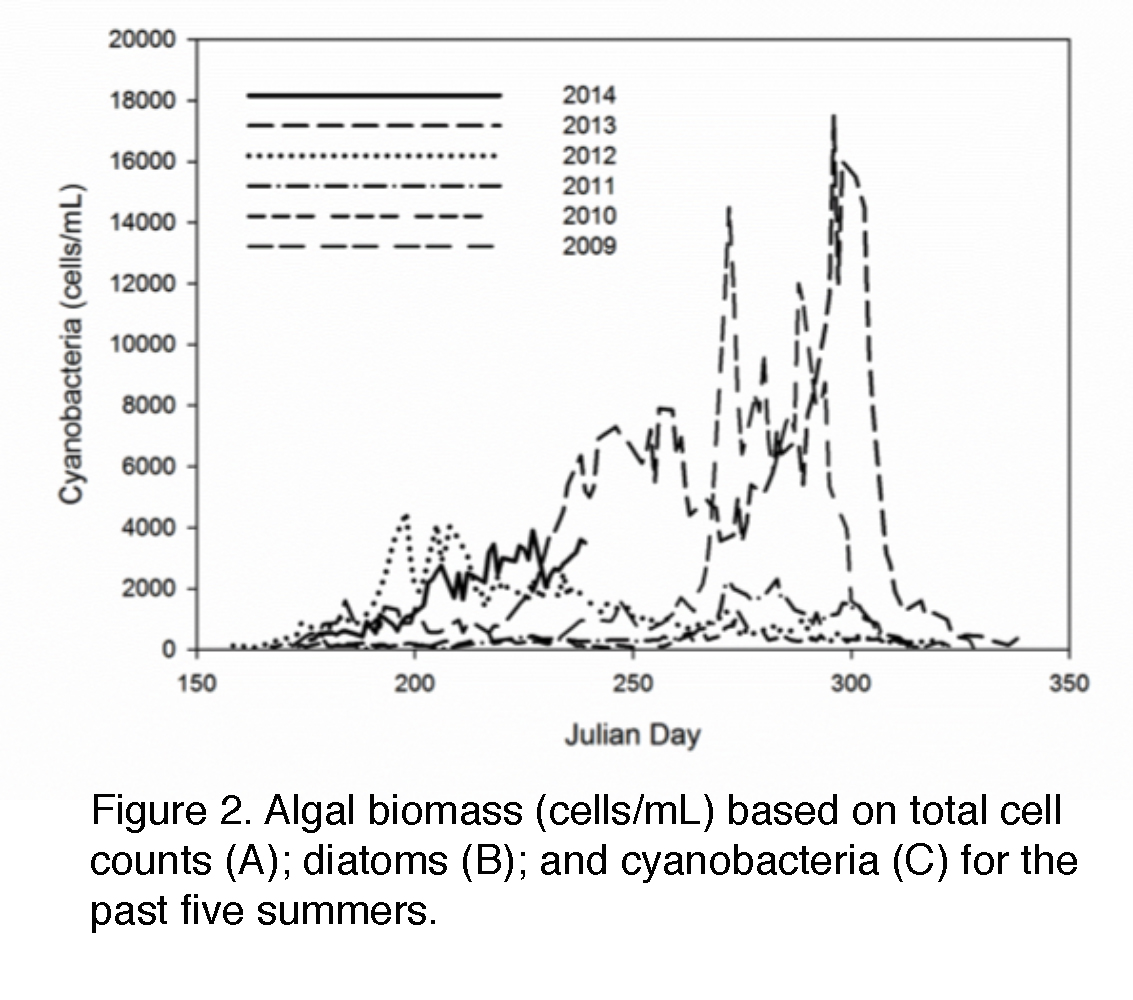
Under the SOS regulations, certain watersheds in Austin allow no increase in pollutant load to receiving streams. Retention irrigation ponds capture stormwater in a holding pond and use the captured volume for irrigation of the surrounding landscaped areas rather than allowing direct release to receiving streams. There is virtually no discharge of runoff off-site and it mimics the undeveloped watershed conditions by allowing infiltration of smaller rainfalls. Retention irrigation systems have excellent pollutant removal efficiency.
Environmental Criteria Manual 1.6.9 (Guidance for Compliance with Technical Requirements of the SOS Ordinance)

Sedimentation/Filtration systems are the primary stormwater treatment device used in Austin. Runoff is first diverted into a sedimentation basin, where particulate pollutants are removed via gravity settling, followed by filtration through an 18” layer of sand. These systems can achieve removal rates of 40-90% for suspended solids, heavy metals, and organics. Properly operating systems will typically capture 90% or more of all runoff from the contributing drainage area, and release it at a slow rate that enhances baseflow and reduces stream erosion.
Sedimentation/filtration systems are not allowed in Barton Springs Zone (BSZ)watersheds as a stand-alone water quality control, as they are not capable of achieving a non-degradation level of treatment.

Two design variations are allowed in Austin. In “full” sedimentation/filtration systems the entire water quality volume is held in the sedimentation basin, which then slowly discharges runoff to the filtration basin via a perforated riser pipe. The alternative “partial” sedimentation/filtration design foregoes the perforated riser pipe, and distributes the water quality volume between the filtration basin and a sediment chamber. The latter is then separated from the filtration bed by a gabion wall or other porous structure. The “full” design is required when the City of Austin is responsible for maintenance.
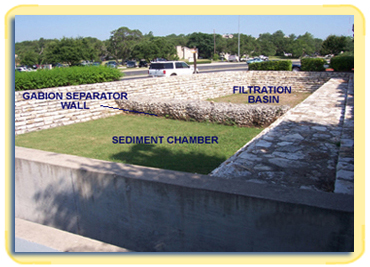
Design guidelines for full and partial sedimentation/filtration ponds are provided in Section 1.6.5.of the Environmental Criteria Manual (see 1.6.5.A for “full” systems and 1.6.5.B for “partial” systems).
- Structural water quality controls may consist of engineered and constructed filters, chambers, basins, or ponds which are designed to treat stormwater runoff by settling, filtration, flotation, absorption, and/or biological processes. The City of Austin Land Development Code establishes the need for structural controls to enhance water quality and the Environmental Criteria Manual provides guidelines for both the design and long-term maintenance of these facilities.
- Structural controls include: biofiltration, porous pavement, rain garden, rainwater harvesting, retention irrigation ponds, sedimentation filtration ponds, vegetated filter strips, and wet ponds.
A low impact development (LID) technique for reducing the impact of stormwater is to "disconnect" impervious areas by routing runoff to a vegetated filter strip. This will promote infiltration, sediment deposition, and filtration of pollutants.
This water quality control is similar to vegetative filter strips described in Section 1.6.7.B of the Environmental Criteria Manual . It will however typically be smaller in order to fit into spaces too small for a full-sized water quality control, but still large enough to provide some treatment. The amount of water quality credit will vary with the size of the filter strip and its drainage area characteristics (size and impervious cover). Vegetative filter strips for treatment of disconnected impervious cover can provide partial treatment equivalent to a sedimentation/filtration system but are not acceptable as a primary method in Barton Springs Zone (BSZ) watersheds, where a non-degradation treatment level is required.
As with other vegetative water quality controls an Integrated Pest Management (IPM) Plan is required.
Design guidelines for this control can be found in Section 1.6.7.F of the Environmental Criteria Manual.

A vegetative filter strip is an innovative water quality control in which runoff is routed as sheet flow through a mildly sloped, well-vegetated area, thus promoting infiltration, sediment deposition, and filtration of pollutants. Because of the need to maintain sheet flow, filter strips are typically used to treat small drainage areas, or areas with low impervious cover. These treatment systems can be used in both Barton Springs Zone (BSZ) and non-BSZ watersheds, but those in BSZ watersheds must be larger. To maintain the proper functioning of these systems the vegetation must not be cut too short (minimum 3” for turfgrass and 18” for bunchgrass), grass clippings must be removed out of the filter strip, and an Integrated Pest Management (IPM) plan is required. Design guidelines for vegetated filter strips are provided in the Environmental Criteria Manual (Section 1.6.7 Alternative Water Quality Controls)

Water Quality Compliance
The Spills and Complaints Response Program enforces the following:
- Surface water quality standards: Austin City Code (Title VI, Chapter 6-5)
- Groundwater or soil remediation standards: The Texas Commission on Environmental Quality (512-339-2929)
State surface water quality rules (State statutes give cities authority to enforce state standards:
- Texas Water Code Title 2, Subtitle D, Water Quality Control), Chapter 26
- Texas Administrative Codes (31 TAC, Chapters 307 and 321)
Federal guidelines
- Clean Water Act (Federal Pollution Control Act of 1972/1977)
- Resource Conservation and Recovery Act of 1976 (40 CFR 198-299)
- National Pollutant Discharge Elimination System of 1990 (40 CFR 122, 124)
There are many closed or abandoned landfills in the Austin area. Many operated before landfills were regulated, and may pose environmental or safety risks. Their boundaries are often unknown or poorly defined. Learn more.
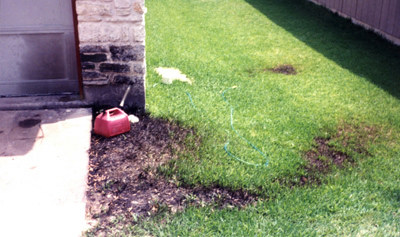
Oil contaminated soil caused by poor housekeeping and improper storage.
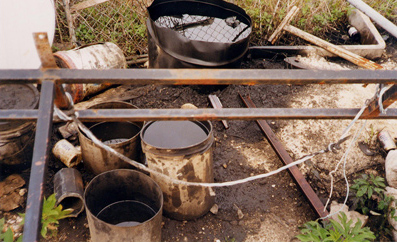
Dead grass and contaminated soil caused by a gasoline spill at a residence.
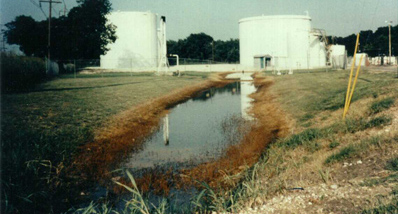
Gasoline spill from above ground storage tanks at a tank farm.
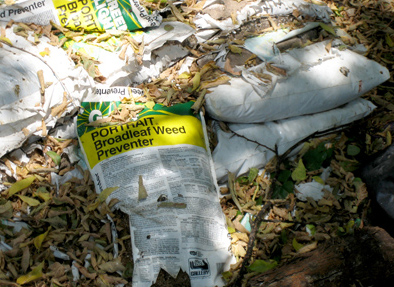
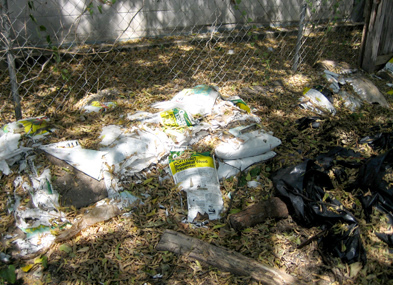
Improper disposal of herbicide (weed killer) on the ground adjacent to an alleyway.
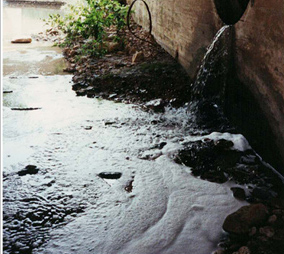
Foam in creek from an illegal detergent discharge.
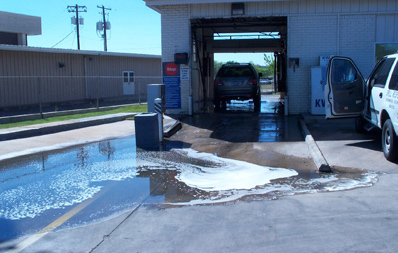
Soapy discharge from a poorly designed car wash facility.
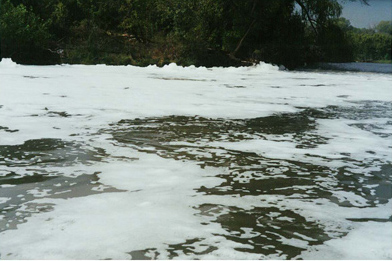
Foam accumulation in a waterway from an illegal discharge.
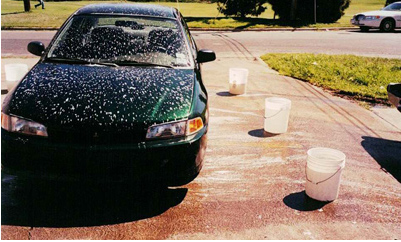
Illegal soapy discharge from a rental car facility washing operation.
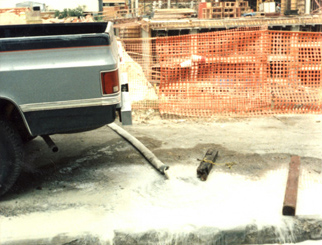
Illegal sediment discharge from construction site dewatering.
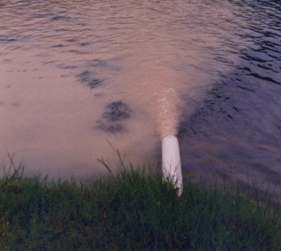
Sediment discharge to Lady Bird Lake.
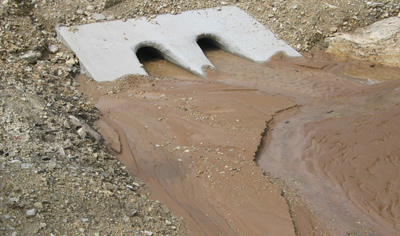
Mud discharge from a construction site.
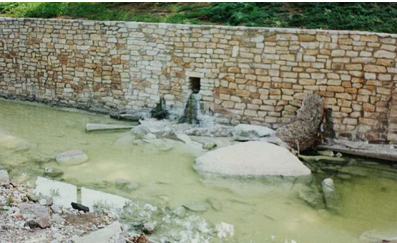
Sediment discharge to a creek from a construction site.
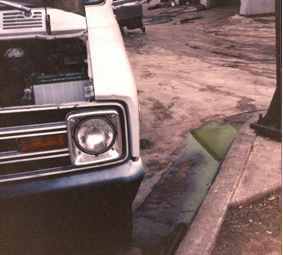
Antifreeze discharge from radiator flushing.
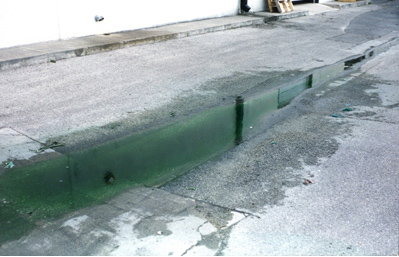
Antifreeze discharge to an alleyway.
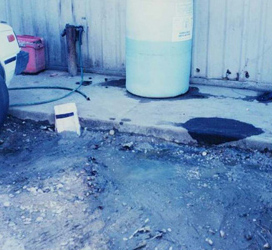
Spills from a cooling dispensing area.
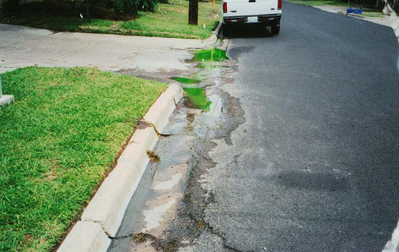
Antifreeze discharge from radiator repair at a residence.
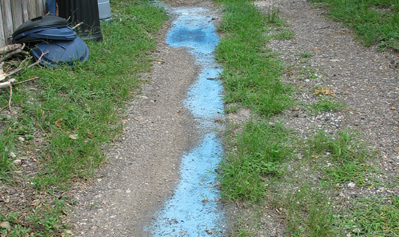
Blue paint discharge from washing paint equipment in residential alleyway.
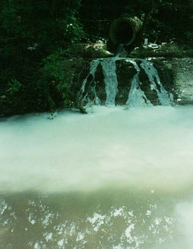
White paint discharged to a creek.
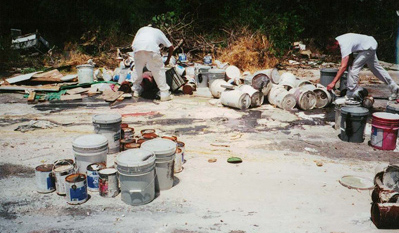
Illegal dumping of paint containers.
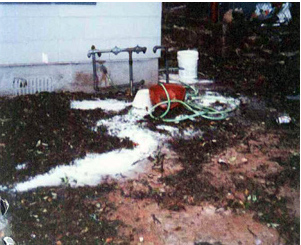
Discharging paint waste outside due to improper cleaning of paint equipment.
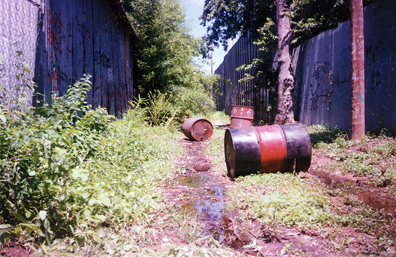
Leaking solvent drums illegally dumped in alleyway.
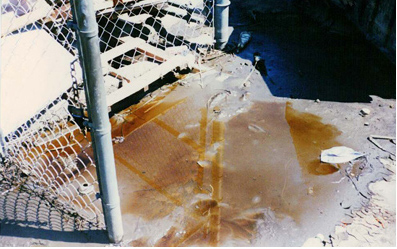
Solvent and sludge dumped on ground at a transmission shop.
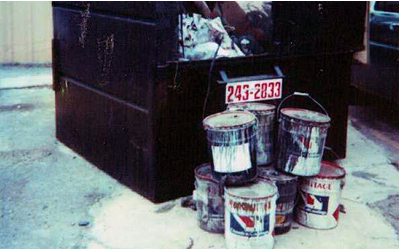
Leaking solvent and paint containers improperly disposed of in and around a dumpster.
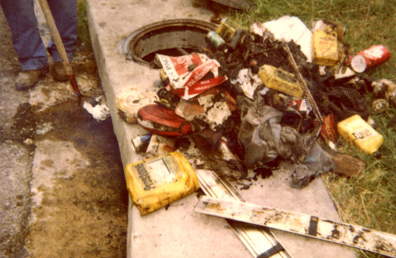
Illegal dumping of trash and debris in a storm drain.
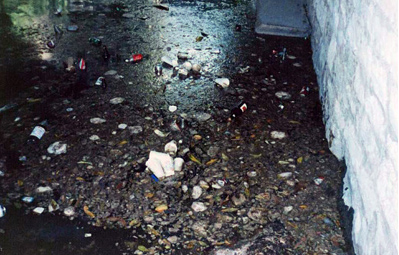
Trash and litter in a local creek.
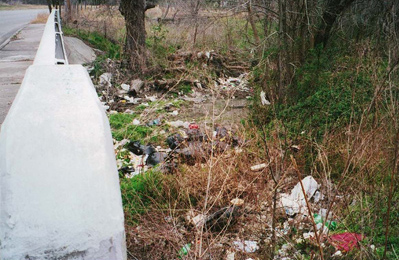
Bags of trash dumped in a creek from a residence.
Visit http://austintexas.gov/online-form/public-information-request to request data.
The Watershed Protection Department has a wide range of educational programs listed at: https://austintexas.gov/department/watershed-protection/education In addition to these programs the Pollution Prevention and Reduction team has several targeted initiatives.
East Austin Environmental Initiative
The East Austin Environmental Initiative (EAEI) was created to help improve the quality of life in a targeted area of Austin, east of IH-35.
The Initiative educates the public and encourages citizen involvement to resolve environmental concerns in East Austin.
For more information, please contact us
Eastside Environmental News is a bi-annual City newsletter that reports on environmental issues in East Austin. SUBSCRIBE to receive the newsletter electronically.
Recent Past Issues
- Spring/Summer 2015 - en Español
- Fall/Winter 2014 - en Español
- Spring/Summer 2014 - en Español
- Fall/Winter 2013 - en Español
- Spring/Summer 2013 - en Español
- Summer 2012 - en Español
- Fall 2011 - en Español
- Spring 2011 - en Español
- Spring 2010 - en Español
Coal Tar Ban/PAH Study
On November 17, 2005 the City of Austin's City Council voted unanimously to ban the sale and use of coal tar containing pavement sealants in the city and its ETJ (Extra Territorial Jurisdiction).
 Staff in the Spills and Complaints Response Program respond to citizen pollution complaints and spills that threaten our creeks or water bodies, 24 hours a day, seven days a week. The number is 512-974-2550.
What to Report
Provide:
- A description of the potential pollution
- The location of the problem
- The source of pollution or the person(s) responsible
- Your name and a number where you can be reached if the investigator needs further information (caller names and phone numbers are confidential)
When to Report
It is very important to report pollution problems while they are in progress or immediately after they are seen to ensure a rapid response and the identification of the pollution and source. Please note that 911 must be called first if there is any threat to life or property during a spill incident.
Report any pollutants that may threaten our creeks and lakes:
Report any pollutants that may threaten our creeks and lakes:
Petroleum Products: motor oil, gasoline, diesel, jet fuels, spills, leaking vehicles, use of fuel for weed control, dumping.
Soaps and Detergents: use in cleaning pavement, vehicles and equipment, failure to connect washing machine to wastewater line.
Silt, Mud and other Sediments: inadequate silt fences, excess water pumped from construction sites.
Antifreeze: improper flushing or draining; dumping on ground or in dumpster.
Latex/Oil-Based Paints & Solvents: cleaning equipment outdoors, dumping on ground, in dumpster, or down storm drain.
Sewage: leaking sanitary sewer lines, malfunctioning septic systems.
Trash and Debris: littering and dumping, household or construction waste. (www.LetsCanItAustin.org )
Restaurant Grease: improper disposal.
Fertilizers and Pesticides: unnecessary or excessive use, application before rainfall.
Pollution Prevention Hotline: 512-974-2550
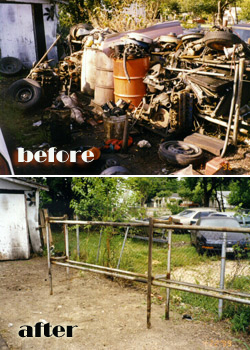 The Stormwater Discharge Permit Program staff conduct inspections of specific commercial and industrial operations within the City of Austin limits to ensure compliance with City Codes which protect water quality. Inspectors locate, verify, and monitor plumbing connections to the City storm sewer system and receiving waterways to prevent illegal discharges of commercial or industrial wastes. Inspectors check waste storage, handling and disposal practices as well as premise maintenance activities to prevent illegal discharges. The operational condition of water quality controls (oil/grit separators, stormwater ponds, hazardous material interceptors, stormdrains) is assessed. A Stormwater Discharge Permit is issued to the facility on an annual basis. Each facility is responsible for obtaining and maintaining a current permit. Legal action is taken against Cod violators when necessary. Inspectors notify and coordinate efforts with other related agencies.
Other program activities include:
- Providing guidance on proposed and existing non-stormwater discharges to the storm sewer system or waterways from activities such as swimming pool filter backwashing, construction work, cooling tower blowdown, and secondary tank containment releases.
- Responding to requests from inspections owing to property assessments, remediations, proposed temporary discharges, or a change in property ownership or management.
- Tracking and dye-tracing plumbing connections to the storm sewer system to determine the route of materials through the system.
- Collecting samples for analysis, typically for enforcement purposes.
- Providing guidance on regulations, pollutant testing, clean up and prevention strategies.
- Reviewing sample plans, remediation plans and stormwater pollution prevention plans.
- Providing records information to the public upon official request.
- Recommending Best Management Practices (BMPs) applicable to each facility or operation. These are pollution prevention measures geared to reducing pollutants at the source and preventing the release of potential pollutants with storm water.
- Providing education materials, such as lists informing operators how to dispose of or recycle waste materials.
- Monitoring compliance for the Texas Pollution Discharge Elimination System to control discharges of pollutants to surface water.
Weed & Feed
There are some good options that allow you to have beautiful lawns AND clean water.
Fertilizer Solutions
Combined products are usually not a good mix – the best time to treat weeds is NOT usually the best time to fertilize
• Spreading weed killer over the entire lawn is usually overkill
• Some lawn weed killers can stress and damage turf if applied during warm weather
• Using an herbicide over the entire lawn can harm nearby trees
• Herbicides can be tracked into the house by pets or on shoes
Weed and Feed products include both fertilizers and weed killers. In most cases, using this combined product is environmentally-unsound.
¡Recoge el Popó!
Para reportar una violación en parques de la Ciudad, áreas públicas, o la propiedad privada, llame al 3-1-1 para más información.
Para informar sobre las condiciones insalubres causadas por la acumulación de desechos de las mascotas en un recinto de animales, póngase en contacto con el Departamento de Salud, 512-972-5600 - Departamento de Salud División de Salud Ambiental.
Ordenanza de la Ciudad
§ 3-4-6 defecación de un perro o gato.
"El dueño o manejador retirará prontamente y sanitariamente deshacerse de las heces que quedan en propiedad pública o privada por un perro o un gato a cargo de la persona, con excepción de los bienes de propiedad por el propietario o gestor del perro o del gato."
Potencial de bien: Hasta $ 500
PET de desecho contiene virus y parásitos que pueden vivir por varios meses. Si no se desechan adecuadamente, desechos de animales representa un riesgo para la salud a la gente y también contamina el agua cuando se lava por la lluvia y el agua de riego en los arroyos y ríos.
SERVICES
Developers: If an IPM plan is required, developers should be informed during the development review process. It is then their responsibility to submit, and comply with, a plan. If the land is then sold, it is their responsibility to communicate the need for the new land owner to abide by the plan.